Tesla (TSLA) Weekly Analysis & Outlook – Week 5 June 2026
Ideas
3 Min Read
In-depth weekly analysis of Tesla (TSLA) for Week 5 June 2026: price chart, latest news, technical and fundamental review, and actionable trading scenarios. Stay updated with support/resistance, MACD, volume, and market catalysts.
Welcome to the comprehensive Tesla (TSLA) weekly analysis for Week 5 of June 2026! 🚗⚡ This post delivers a deep dive into TSLA’s technical landscape, key news, and actionable trading scenarios for the week of June 29, 2026. Whether you’re a trader, investor, or Tesla enthusiast, this analysis will help you navigate the week ahead with clarity and confidence.
📊 Tesla (TSLA) Price Chart Overview
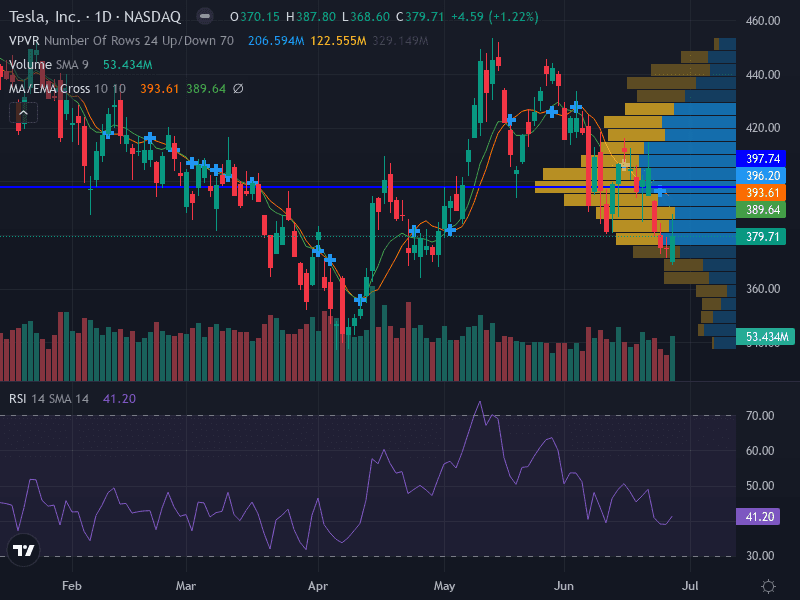
See the full-width chart above for detailed price, volume, and MACD action.
Trend: Sideways, with price trapped between the 10- and 50-day EMAs.
Momentum: RSI at 41.20 (neutral), MACD slightly below signal line (neutral bias).
Pattern: Broadening formation; consolidation between $370 and $396.
Volume: Decreasing on recent pullback, lighter than May’s rally.
📰 Latest News & Catalysts (June 22–29, 2026)
Headline | Summary | Source |
|---|---|---|
NHTSA Closes Steering Probe | The U.S. NHTSA ended its multi-year investigation into power steering issues for ~376,000 Model 3/Y vehicles, following Tesla’s recall fix. This removes a regulatory overhang and may boost investor sentiment. | |
Virtual Power Plant Launch | Tesla, Sunrun, and Renew Home launched a 16 GW virtual power plant, aggregating home energy for AI data centers. This signals Tesla’s push into energy and AI infrastructure. | |
FSD Lawsuit Settled | Tesla quietly settled a lawsuit from a 2023 Full Self-Driving accident involving a pedestrian. While removing legal risk, it keeps FSD safety in the spotlight. |
📈 Technical Analysis
Support Levels: $370.00 (major), $360.00 (minor)
Resistance Levels: $396.20 (major), $420.00 (minor)
Pattern: Broadening formation, indicating volatility and indecision. Price is consolidating between $370 and $396.
MACD: Slightly below the signal line, suggesting a neutral to mildly bearish bias. Awaiting a clear crossover for direction.
Volume: Recent pullback occurred on lower volume, indicating lack of strong conviction from sellers. May’s rally saw heavier volume, so watch for a volume spike to confirm any breakout.
RSI: At 41.20, neither overbought nor oversold—reinforcing the neutral stance.
🧭 Chart Structure & Trade Ideas
Aggressive Bearish: Sell on break below $370, stop-loss at $380, target $360. Rationale: Potential continuation to lower support if sellers gain control.
Conservative Bullish: Buy on break above $396.20, stop-loss at $389, target $420. Rationale: Wait for confirmation of bullish momentum before entering.
Invalidation: Sustained close above $420 or below $360 would indicate a stronger directional move and invalidate the current range-bound thesis.
Risk Management: Risk 1% of capital per trade; use ATR (14-day) to set stop-loss distance.
🔎 Fundamental & News Impact
Regulatory Relief: The closure of the NHTSA probe removes a significant risk, likely supporting sentiment in the near term.
Innovation: The virtual power plant launch highlights Tesla’s continued expansion into energy and AI, which could drive future growth.
Legal Risks: Settlement of the FSD lawsuit reduces headline risk but keeps safety concerns in focus.
Market Context: US equities were mixed this week, with chipmaker weakness and macro uncertainty (inflation, trade gap, mortgage rates) impacting risk appetite.
Analyst Sentiment: 46% Buy, 40% Hold, 46% Sell (split consensus). Price targets: $371.81 (Q2 2026), $349.09 (1-year), with upside to $419.81 and $446.78 if resistance breaks.
Valuation: Market cap ~$1.42T, P/E ~346.89, 2026 EPS estimate $1.89, revenue $102.4B.
📅 Possible Scenarios for Week 5 June 2026
Scenario | Trigger | Actionable Levels | Probability |
|---|---|---|---|
Bullish 🟢 | Break and close above $396.20 | Buy above $397, target $420, stop-loss $389 | Moderate (requires volume confirmation) |
Bearish 🔴 | Break and close below $370 | Sell below $370, target $360, stop-loss $380 | Moderate (if volume increases on breakdown) |
Neutral/Range 🟡 | Price remains between $370 and $396 | Wait for breakout; intraday trades only | High (current pattern favors consolidation) |
📊 Key Metrics Table
Metric | Value |
|---|---|
Current Price (June 28, 2026) | $377.91 |
52-Week Range | $288.77 – $498.83 |
Market Cap | $1.42T |
P/E Ratio | 346.89 |
2026 EPS Estimate | $1.89 |
2026 Revenue Estimate | $102.4B |
Volume (last session) | 53.43M |
🔔 Summary & Outlook
Tesla (TSLA) enters Week 5 of June 2026 in a consolidation phase, with price action constrained by key support at $370 and resistance at $396.20. The closure of the NHTSA probe and new energy ventures provide a positive backdrop, but legal and macro risks persist. Traders should watch for a decisive breakout from the current range, with volume as a key confirming indicator. Neutral to moderate bullish/bearish scenarios are in play, but patience and risk management are essential in this sideways market.
Disclaimer: This analysis is for informational purposes only and does not constitute investment advice. Please conduct your own research or consult a financial advisor before making trading decisions.

Julian Vance
Julian Vance is an independent writer and quantitative strategist. He writes about trading automation and account-management workflows for Copygram.
Join our newsletter list
Sign up to get the most recent blog articles in your email every week.

More Articles