Nvidia (NVDA) Weekly Analysis & Trading Outlook – Week 1 July 2026
Ideas
3 Min Read
In-depth analysis of Nvidia (NVDA) for Week 1 July 2026: technical chart review, latest news, support/resistance, and actionable trading scenarios. Stay informed for the week ahead.
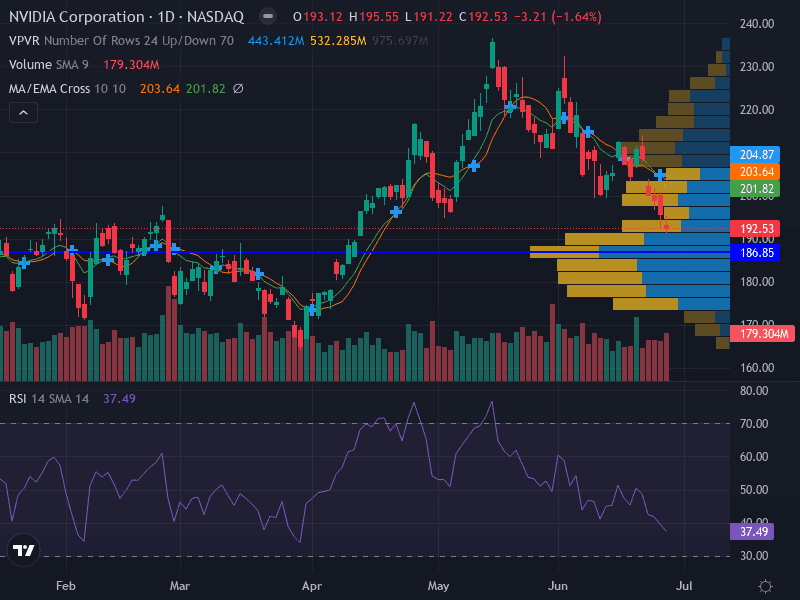
Welcome to the comprehensive weekly analysis for Nvidia (NASDAQ: NVDA) – Week 1 July 2026. In this post, we’ll break down NVDA’s technical chart, summarize the latest news and catalysts, and provide actionable scenarios for traders and investors. Let’s dive in! 🚀
🗞️ Latest News & Catalysts (June 22–29, 2026)
Halos for Robotics Launch: Nvidia unveiled Halos for Robotics, the industry’s first full-stack safety system for physical AI, expanding its platform beyond GPUs and into robotics safety and integration. This move is expected to broaden Nvidia’s total addressable market in automation and industrial AI. [StockTitan]
Supercomputing & AI Expansion: At the ISC High Performance 2026 conference, Nvidia introduced new AI software for scientific research and announced the Vera CPU, which will power new supercomputers at Los Alamos National Laboratory. Additionally, a record 35 new Nvidia AI HPC supercomputers are in development across Europe. [Nvidia Newsroom]
Capital Structure & Market Sentiment: Nvidia announced plans to issue investment-grade debt for the first time in years, prompting a modest pullback in shares. CEO Jensen Huang described the recent tech selloff as a “buying opportunity,” emphasizing the long-term AI buildout. [Barron’s]
📊 Technical Analysis: Chart Review for Week 1 July 2026
Aspect | Details |
|---|---|
Trend | Downtrend – price below 10- and 20-day EMAs, confirming downward pressure |
Momentum | RSI at 37.49 (bearish, approaching oversold); MACD decreasing (bearish) |
Support | Major: $186.85 (prior swing low); Minor: $179.30 |
Resistance | Major: $203.64 (EMA confluence); Minor: $204.87 |
Pattern | Potential descending channel; lower highs and lows |
Volume | Higher on down moves, indicating stronger selling pressure |
🔍 Chart Insights
Bearish Structure: NVDA is trading below key moving averages, with momentum indicators (RSI, MACD) confirming the bearish bias.
Volume Analysis: Selling volume spikes on down days suggest institutional distribution and caution for bullish traders.
Pattern Watch: The descending channel pattern highlights a risk of continued lower lows unless a reversal is triggered by news or macro factors.
📈 Fundamental & News Impact
Product Innovation: The Halos for Robotics launch positions Nvidia as a leader in physical AI safety, potentially opening new revenue streams in industrial automation.
AI & Supercomputing Leadership: The Vera CPU and expansion of AI supercomputers reinforce Nvidia’s dominance in high-performance computing and scientific research.
Capital Structure: The investment-grade debt issuance may signal confidence in long-term growth but introduces short-term uncertainty as investors digest the new leverage.
Macroeconomic Relief: The peace agreement between the US and Iran eased inflation fears, supporting tech sector sentiment.
🛠️ Actionable Scenarios for Week 1 July 2026
Scenario | Trigger | Action | Key Levels |
|---|---|---|---|
Bullish 🟢 | Break above $205.00 with volume | Consider long positions targeting $215.00–$220.00; monitor reversal confirmation | Entry: $205.00+ |
Bearish 🔴 | Failure to reclaim $203.00; breakdown below $192.00 | Short/sell with targets at $186.85 (major support) and $179.30; use tight stops | Entry: $192.00 |
Neutral 🟡 | Range-bound between $192.00–$204.00 | Wait for breakout or breakdown; avoid new positions until clear direction | Watch: $192.00–$204.00 |
Risk Management Tips
Risk 0.5–1.0% of capital per trade.
Consider ATR-based stops to account for volatility.
Monitor volume and news for early signs of trend reversal.
📅 Macro & Event Calendar
July 2026: Watch for upcoming earnings pre-announcements, macroeconomic data, and further product launches from Nvidia.
Fed Rate Watch: 50% probability of a 25bps rate hike in September could impact tech valuations.
🔗 Key Resources & References
Disclaimer: This analysis is for informational purposes only and does not constitute investment advice. Trading involves risk. Please conduct your own research or consult a professional before making investment decisions.

Julian Vance
Julian Vance is an independent writer and quantitative strategist. He writes about trading automation and account-management workflows for Copygram.
Join our newsletter list
Sign up to get the most recent blog articles in your email every week.

More Articles