Ethereum (ETHUSD) Weekly Analysis & Outlook – Week 1 July 2026
Ideas
3 Min Read
In-depth weekly analysis of Ethereum (ETHUSD) for Week 1 July 2026: chart review, support/resistance, MACD, volume, news impact, and actionable trading scenarios. Stay informed with our comprehensive ETHUSD outlook.
Ethereum (ETHUSD) Weekly Analysis & Outlook – Week 1 July 2026
Welcome to our comprehensive Ethereum (ETHUSD) analysis for Week 1 of July 2026. This week’s review combines technical chart insights, the latest news, and actionable trading scenarios to help you navigate the current market environment. Let’s dive in! 🚀
📊 Chart Overview & Technical Analysis
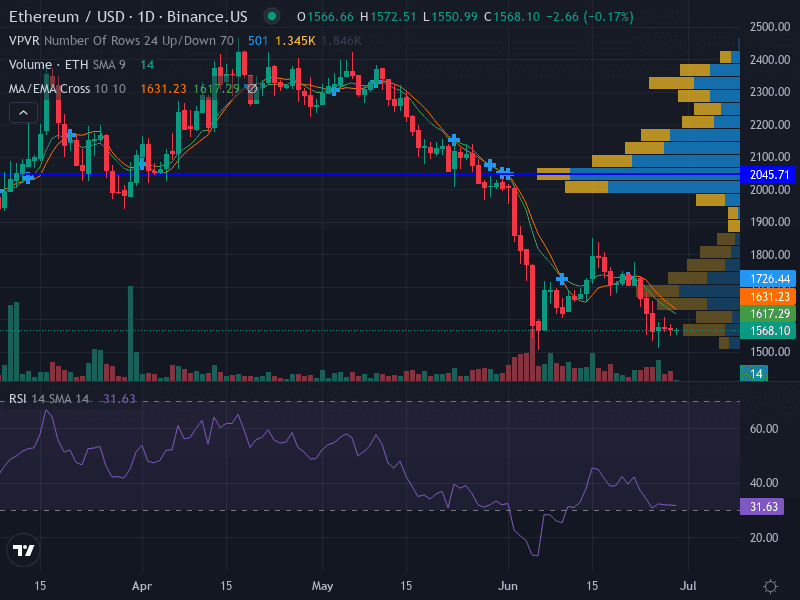
Trend: Bearish — ETHUSD is trading below major moving averages (10- and 50-day EMAs), confirming persistent selling pressure.
Momentum: RSI at 31.63 — Oversold territory, suggesting a possible short-term bounce but an overall bearish structure.
Pattern: Descending channel formation, indicating continued weakness.
Volume: Increasing on declines, which signals strong conviction among sellers.
MACD: Bearish crossover, with the MACD line below the signal line and histogram deep in negative territory.
Key Level | Type | Significance |
|---|---|---|
1568.00 | Support | Major – Recent swing low |
1500.00 | Support | Psychological level |
1631.23 | Resistance | Minor – Recent swing high |
1726.44 | Resistance | Major – Previous support, now resistance |
Summary: The technical setup for ETHUSD this week remains bearish, with the price locked in a descending channel and momentum indicators confirming downside risk. Volume spikes on down days reinforce the sellers’ control. A break below 1568.00 could accelerate losses toward the psychological 1500.00 level, while any relief rally faces stiff resistance at 1631.23 and 1726.44.
📰 Latest News & Short-Term Catalysts
Macro Headwinds: A hotter-than-expected US PCE inflation print (4.1% for May) and a hawkish Federal Reserve under Chair Kevin Warsh have reinforced a higher-for-longer interest rate environment, pressuring risk assets like ETHUSD. (source)
ETF Outflows & Whale Selling: Seven consecutive days of net outflows from US spot ETH ETFs (totaling $273M) and dormant whale wallets offloading ~33,600 ETH (~$52.5M) near the $1,500 demand zone have weighed on sentiment. (source)
Protocol Upgrade Delay: The anticipated Glamsterdam network upgrade has been delayed to Q3 2026, dampening optimism around Ethereum’s roadmap. (source)
Other notable developments include legislative progress on the CLARITY Act, BitMine’s $136M ETH accumulation, and a major options expiry (138,000 ETH, max pain at $1,725) adding to volatility.
🔎 Fundamental & News Impact Analysis
Ethereum’s fundamentals remain robust in the long term, but the current environment is dominated by macroeconomic and technical headwinds. The combination of persistent ETF outflows, whale selling, and delayed protocol upgrades has led to a fragile sentiment. Institutional accumulation and legislative progress provide some support, but the near-term outlook is clouded by inflation, Fed policy, and technical breakdowns.
Factor | Impact |
|---|---|
Fed Policy & Inflation | Negative |
ETF Flows | Negative |
Protocol Upgrade | Negative (due to delay) |
Institutional Accumulation | Positive |
Legislative Progress | Positive |
📅 Actionable Scenarios for Week 1 July 2026
Given the current technical and fundamental setup, here are the most probable scenarios for ETHUSD this week:
Scenario | Probability | Key Levels | Strategy |
|---|---|---|---|
Bullish | Low | Above 1631.23, target 1726.44 | Wait for a confirmed breakout above 1631.23 with strong volume; consider long positions with tight stops below 1631.00. |
Bearish | High | Below 1568.00, target 1500.00 | Short on breakdown below 1568.00, stop-loss above 1631.00. Aggressive traders may add on rallies rejected at 1631.23. |
Neutral | Moderate | Between 1568.00 and 1631.23 | Range-trade between support and resistance; avoid large positions until a clear breakout or breakdown occurs. |
Risk Management: Limit risk to 0.5–1.0% of capital per trade. Use ATR-based stops and monitor for volatility spikes around macro events (e.g., Wednesday’s CPI report, Fed meeting).
Invalidation: A weekly close above 1726.44 would shift the bias to neutral or short-term bullish.
📈 Volume & MACD Interpretation
Volume: Spikes on down days confirm strong selling pressure. Watch for volume divergence on attempted rallies as a sign of potential reversal.
MACD: Bearish crossover supports the downtrend. Only a bullish MACD cross with price above 1631.23 would suggest a reversal.
🗓️ Key Dates & Events to Watch
Wednesday, July 2: US CPI report — critical for risk sentiment.
Fed Meeting: Any change in rate guidance could trigger volatility.
Protocol Upgrade News: Watch for updates on Glamsterdam or Hegota timelines.
Options Expiry: Monitor for volatility around large ETH options expirations.
🔔 Summary & Outlook
ETHUSD enters Week 1 of July 2026 under significant bearish pressure, with technicals and macro factors aligned to the downside. While oversold conditions could prompt a short-term bounce, the path of least resistance remains lower unless bulls reclaim key resistance levels. Stay nimble, manage risk, and monitor macro headlines closely.
Disclaimer: This analysis is for informational purposes only and does not constitute investment advice. Always conduct your own research and consult a financial advisor before making trading decisions.

Julian Vance
Julian Vance is an independent writer and quantitative strategist. He writes about trading automation and account-management workflows for Copygram.
Join our newsletter list
Sign up to get the most recent blog articles in your email every week.

More Articles