Bitcoin (BTCUSD) Weekly Outlook & Trade Scenarios – Week 1 July 2026
Ideas
3 Min Read
In-depth weekly analysis for Bitcoin (BTCUSD) covering technicals, ETF outflows, MicroStrategy news, support/resistance, and actionable scenarios for Week 1 July 2026. Read for a comprehensive trading outlook.
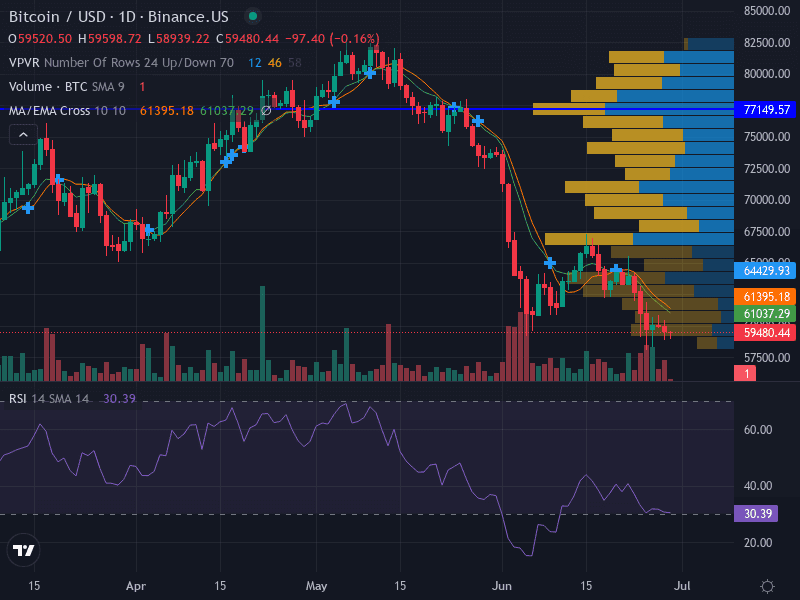
Welcome to the comprehensive Bitcoin (BTCUSD) analysis for Week 1 of July 2026. This week’s review covers the latest price action, technical structure, fundamental drivers, and actionable scenarios for traders and investors. As Bitcoin faces a confluence of bearish momentum, record ETF outflows, and shifting institutional sentiment, understanding the current landscape is crucial for effective decision-making. Let’s break down the week’s developments and what they mean for the days ahead.
⚠️ This analysis is for informational purposes only and does not constitute financial advice. Please conduct your own research before making trading decisions.
📈 BTCUSD Chart Overview (Week 1 July 2026)
Trend: Downtrend – price below 9- and 20-day EMAs
Momentum: RSI at 30.39 (oversold), MACD bearish
Pattern: Descending channel with lower lows and highs
Volume: High on declines, lower during rallies
Key Support: $58,500 (major), $57,500 (minor)
Key Resistance: $61,400 (major), $64,400 (minor)
📰 Latest News & Catalysts (Past 7 Days)
Event | Summary | Source |
|---|---|---|
Record ETF Outflows | U.S. spot Bitcoin ETFs saw $6.35B in outflows, including $1.79B last week, marking the second-largest weekly redemption since launch and weighing heavily on price. | |
MicroStrategy Crisis | MicroStrategy’s stock plunged, causing billions in unrealized losses and triggering a crisis of confidence in Bitcoin’s institutional narrative. | |
Bearish Technical Breakdown | BTC confirmed a breakdown from a multi-month symmetrical triangle, shifting sentiment negative and triggering $1B in liquidations (mostly from long positions). |
🔍 Technical Analysis
1. Price Structure & Trend
BTCUSD is entrenched in a downtrend, trading below both the 9- and 20-day exponential moving averages. This signals persistent bearish momentum.
The descending channel pattern is characterized by lower highs and lower lows, confirming a bearish structure.
2. Support & Resistance Levels
Level | Type | Significance |
|---|---|---|
$58,500 | Major Support | Recent swing low, key for potential bounce |
$57,500 | Minor Support | Below major support, next downside target |
$61,400 | Major Resistance | Confluence of EMAs, pivotal for trend reversal |
$64,400 | Minor Resistance | Upper boundary of recent trading range |
3. Momentum Indicators
RSI: At 30.39, BTCUSD is in oversold territory, which could signal a short-term bounce but is not a guarantee of reversal.
MACD: Bearish crossover, confirming trend weakness.
Volume: Spikes on declines indicate strong selling pressure; rallies are met with lower volume, suggesting weak buyer conviction.
4. Chart Pattern
The descending channel and recent breakdown from a symmetrical triangle highlight a market in distribution, with sellers in control.
📊 Fundamental & News Impact
ETF Outflows: The largest streak of outflows from U.S. spot Bitcoin ETFs since their debut is a clear sign of waning institutional interest, removing a key source of demand and exacerbating downside risk.
MicroStrategy’s Losses: The sharp drop in MSTR’s stock and its impact on sentiment has created a “crisis of confidence” among institutional holders, as noted by Galaxy Digital’s CEO.
Liquidations & Volatility: Over $1B in liquidations, mostly from long positions, have accelerated the selloff, while El Salvador’s continued accumulation is a rare bullish outlier.
Macro Factors: The Federal Reserve’s hawkish stance and broader risk-off sentiment in global markets are contributing to the bearish backdrop for Bitcoin.
🧭 Possible Scenarios for the Upcoming Week
Scenario | Description | Key Price Levels | Probability |
|---|---|---|---|
🐻 Bearish | Continuation of downtrend; price fails to reclaim $61,400 and breaks below $58,500, targeting $57,000 or lower. | Below $58,500 | High |
🐂 Bullish | Short-term relief rally if oversold RSI triggers a bounce; needs daily close above $61,400 to shift bias to neutral/bullish. | Above $61,400 | Low/Moderate |
⚖️ Neutral | Sideways consolidation between $58,500 and $61,400 as market digests recent news and ETF flows stabilize. | $58,500–$61,400 | Moderate |
Actionable Trade Ideas
Aggressive: Consider shorting near $60,000 on failed rallies, with stop loss at $61,500 and target at $58,500. Rationale: Downtrend continuation.
Conservative: Wait for a confirmed break below $58,500, then short at $58,300 with stop at $60,000 and target at $57,000.
Invalidation: A daily close above $61,400 would shift bias to neutral and could trigger short covering.
Risk Management: Limit risk to 0.5–1.0% of capital per trade; use ATR(14) to size stops appropriately.
🔑 Key Takeaways
Bitcoin is in a clear downtrend, pressured by record ETF outflows and negative institutional sentiment.
Major support at $58,500 is critical; a break below could accelerate losses toward $57,000 or lower.
Short-term bounces are possible due to oversold conditions, but the overall bias remains bearish unless $61,400 is reclaimed.
Traders should monitor ETF flows, macro headlines, and key price levels for signs of reversal or further breakdown.
Stay tuned for next week’s update as we continue to track Bitcoin’s evolving landscape. For more insights, follow the latest news from TradingView, Moomoo, and Pluang.

Julian Vance
Julian Vance is an independent writer and quantitative strategist. He writes about trading automation and account-management workflows for Copygram.
Join our newsletter list
Sign up to get the most recent blog articles in your email every week.

More Articles