Amazon (AMZN) Stock Analysis & Outlook – Week 5 June 2026
Ideas
3 Min Read
Comprehensive weekly analysis of Amazon (AMZN) stock for Week 5 June 2026. Includes technical chart, key news, support/resistance, trading scenarios, and actionable insights for traders and investors.
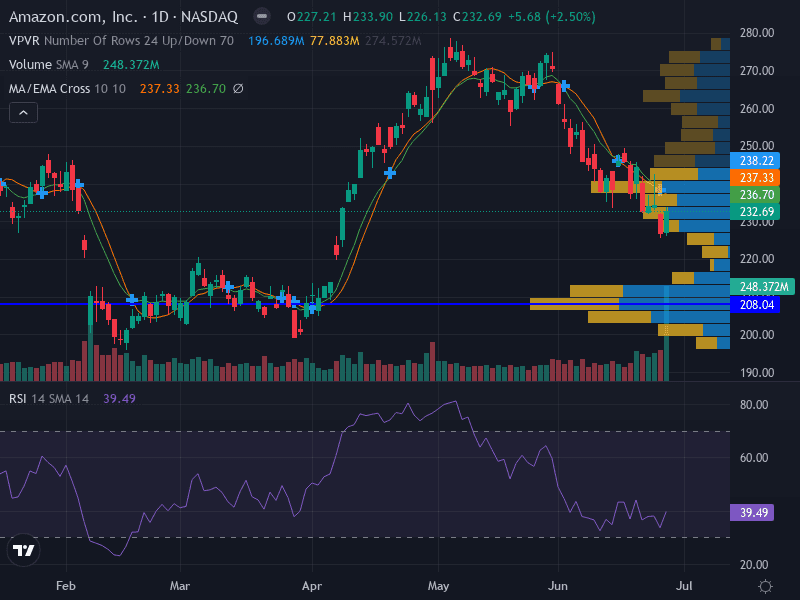
Welcome to the in-depth weekly analysis of Amazon.com Inc. (NASDAQ:AMZN) for Week 5 of June 2026! This comprehensive review blends technical chart insights, the latest news, and actionable trading scenarios to help you navigate the week ahead. Whether you’re a trader, investor, or market watcher, this post is designed to provide a world-class, data-driven perspective on AMZN’s current standing and outlook. 📊📰
Quick Summary
Trend: Bearish (price below 10- and 20-day EMAs, forming lower highs)
Key Support: $232.50 (major), $208.00 (historical low)
Key Resistance: $237.00 (minor), $248.00 (major)
Pattern: Descending channel, price near lower boundary
Momentum: RSI 39.49 (bearish)
Volume: Decreasing on declines, uptick on minor rallies
Major Catalysts: Prime Day 2026, AI chip deals, Q1 earnings beat
Latest News & Catalysts (June 22–29, 2026)
Event | Details | Impact |
|---|---|---|
Prime Day 2026 | June 23–26, first-ever 4-day event, spanning 23 countries | Expected to drive record online spending and test consumer resilience [source] |
AI Chips Momentum | Chip revenue exceeds $20B run rate; OpenAI (2GW) & Anthropic (5GW) Trainium deals | Long-term bullish, supports durable earnings and AI infrastructure dominance [source] |
Q1 2026 Results | Revenue $181.5B (+17% YoY), EPS far above expectations | Confirms AWS reacceleration and advertising growth [source] |
Additional Context
Market Sentiment: 57 analysts rate AMZN a “Strong Buy” (mean target $315.85, ~22% upside)
Headwinds: Heavy AI capex, hyperscaler sector weakness, Prime membership saturation
Macro: Broader tech selloff, cautious investor sentiment
Technical Analysis
Price Action & Chart Structure
Trend: The chart shows a clear downtrend, with AMZN trading below both the 10-day and 20-day exponential moving averages (EMAs). Lower highs are being formed, confirming bearish momentum.
Pattern: Price action is contained within a descending channel. The current price is near the lower boundary, suggesting a potential inflection point.
Support Levels:
$232.50 – Major support, recently tested
$208.00 – Historical low, strong long-term support
Resistance Levels:
$237.00 – Minor resistance, overlaps with EMAs
$248.00 – Major resistance, previous support turned resistance
Volume: Volume has been decreasing on declines, indicating some seller exhaustion, but there’s a slight uptick on minor rallies, suggesting opportunistic buying.
MACD: The MACD remains below the signal line, reinforcing the bearish bias. No clear bullish divergence is present yet.
RSI: At 39.49, the RSI is in bearish territory but not yet oversold, leaving room for further downside before a technical bounce is likely.
Technical Table
Indicator | Value | Interpretation |
|---|---|---|
10-day EMA | ~$236.50 | Price below EMA, bearish |
20-day EMA | ~$237.00 | Price below EMA, bearish |
MACD | Negative | Bearish momentum |
RSI | 39.49 | Bearish, not oversold |
Volume | Decreasing on declines | Possible seller exhaustion |
Fundamental & News Impact
Prime Day 2026: The four-day event (June 23–26) is a critical test of consumer demand and retail momentum. While it’s expected to drive a near-term boost, Prime membership saturation could limit incremental gains.
AI Chips & Cloud: Amazon’s AI chip business (Trainium, Graviton, Nitro) has exceeded a $20B annual run rate, with major deals signed with OpenAI and Anthropic. This supports a durable long-term earnings runway and enhances AWS’s competitive edge.
Q1 2026 Earnings: Revenue of $181.5B (+17% YoY) and EPS above expectations confirm fundamental strength. AWS and advertising segments are key growth drivers.
Risks: Heavy AI capital expenditures may pressure near-term margins and free cash flow. The broader tech sector’s volatility and hyperscaler weakness also weigh on sentiment.
Analyst Consensus: Despite short-term headwinds, analysts remain overwhelmingly bullish, with a consensus “Strong Buy” and a mean target of $315.85 (~22% upside).
Trading Scenarios for the Week Ahead
Based on the technical and fundamental setup, here are the most probable scenarios for AMZN in Week 5 of June 2026:
Scenario | Trigger/Signal | Action | Target | Stop Loss |
|---|---|---|---|---|
Bullish 🟢 | Break & close above $237.00 (EMAs) | Buy on breakout | $248.00 (major resistance) | $232.50 |
Bearish 🔴 | Failure to break $237.00, or break below $232.50 | Sell/short on breakdown | $208.00 (historical support) | $237.00 |
Neutral ⚪ | Range-bound between $232.50 and $237.00 | Wait for clear breakout or breakdown | — | — |
Aggressive Bearish: Sell near $236.00 if price fails to break EMAs, stop at $240.00, target $232.50. If $232.50 breaks, consider selling $231.00 with stop at $236.00, target $208.00.
Invalidation: A weekly close above $248.00 would shift the bias to neutral/bullish and invalidate the short-term bearish view.
Risk Management: Risk 0.5–1.0% of capital per trade. Use ATR(14-day) for dynamic stop placement.
Key Takeaways & Outlook
Short-term: Bearish technicals dominate, but Prime Day and AI news could spark volatility and reversals.
Medium-term: Strong fundamentals and analyst conviction provide a bullish backdrop if technicals stabilize.
Watch: $232.50 and $237.00 as key inflection points for the week.
Long-term investors: May view current weakness as an opportunity, given robust AI/cloud growth and analyst targets.
Disclaimer: This analysis is for informational purposes only and does not constitute investment advice. Please conduct your own research or consult a financial advisor before making trading decisions.

Julian Vance
Julian Vance is an independent writer and quantitative strategist. He writes about trading automation and account-management workflows for Copygram.
Join our newsletter list
Sign up to get the most recent blog articles in your email every week.

More Articles