NVIDIA (NVDA) Analysis & Outlook – Week 1 May 2026
Ideas
3 Min Read
Comprehensive weekly analysis of NVIDIA (NVDA) for Week 1 May 2026: technical chart review, latest news, key support/resistance, and actionable scenarios for traders and investors.
Weekly Analysis: NVIDIA (NVDA) – Week 1 May 2026
Welcome to this week’s in-depth analysis of NVIDIA (NASDAQ:NVDA) for Week 1 of May 2026. This blog post provides a comprehensive technical and fundamental review, actionable trading scenarios, and a clear outlook for the week ahead. Whether you’re a trader, investor, or market observer, this guide is designed to help you navigate NVDA’s price action and the latest market context. 📊
1. Chart Overview & Technical Landscape
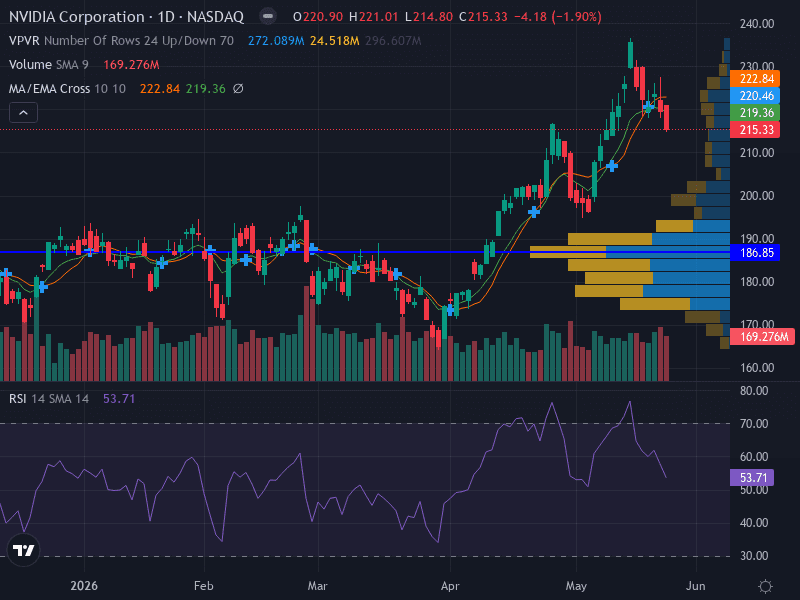
Chart summary: NVDA is currently in a consolidation phase, trading near its moving averages with mixed signals. The price is moving sideways, forming a horizontal channel, and momentum indicators suggest indecision.
Support levels: 196.17 (major, high volume node), 182.88 (minor)
Resistance levels: 204.58 (major, recent high), 202.17 (minor)
Trend: Sideways, with price between 10- and 50-day EMAs
Momentum: RSI at 53.01 (neutral); EMA cross shows indecision
Volume: High on downturns, suggesting caution
Pattern: Consolidation range; horizontal channel structure
Key Level | Type | Significance |
|---|---|---|
204.58 | Resistance | Major – recent high |
202.17 | Resistance | Minor – short-term |
196.17 | Support | Major – high volume node |
182.88 | Support | Minor – previous low |
2. Latest News & Fundamental Context 📰
Earnings Conference Call Announced: NVIDIA will host its Q1 fiscal 2027 results call on May 20, 2026. This is the primary scheduled event on the horizon, with investors likely positioning ahead of the report. [Source]
Analyst Sentiment: DBS Bank recently raised its price target for NVDA, reflecting ongoing optimism in the AI and semiconductor sector. However, the stock remains below the $200 level, with analysts watching for a catalyst to break out. [Source]
Stock Price Context: NVDA trades at approximately $198.48, down 0.40% in the last 24 hours, reflecting the ongoing consolidation and lack of a decisive catalyst. [Source]
There are no major macroeconomic or sector-wide catalysts reported in the last 7 days. The focus remains on the upcoming earnings and technical levels.
3. Technical Analysis 📈
Support & Resistance: NVDA is range-bound between 196.17 (support) and 204.58 (resistance). A break above or below these levels could set the tone for the next trend.
Pattern Recognition: The horizontal channel suggests indecision, with neither bulls nor bears in control. This is typical ahead of major events like earnings.
MACD & Volume: MACD is flat, confirming the lack of momentum. Volume spikes on downturns indicate caution among investors, possibly due to uncertainty ahead of earnings.
RSI: The RSI at 53.01 is neutral, suggesting neither overbought nor oversold conditions.
Indicator | Current Reading | Interpretation |
|---|---|---|
MACD | Flat | No clear momentum |
RSI | 53.01 | Neutral |
Volume | High on downturns | Investor caution |
4. Fundamental & News Impact 🔎
NVDA’s price action is largely driven by anticipation of its upcoming earnings report. The lack of major news or macro catalysts in the last week means technical levels are likely to dominate trading decisions. The raised analyst price target provides a slight bullish undertone, but the absence of a breakout above $200 keeps the bias neutral for now.
5. Actionable Scenarios for Week 1 May 2026 🚦
Based on the current technical and fundamental setup, here are the most probable scenarios for NVDA this week:
Scenario | Trigger | Action | Key Levels | Probability |
|---|---|---|---|---|
Bullish | Breakout above 204.58 | Buy on breakout, target 210.00, stop-loss 200.00 | 204.58 / 210.00 | Moderate |
Bearish | Breakdown below 196.17 | Sell on breakdown, target 182.88, stop-loss 200.00 | 196.17 / 182.88 | Low-Moderate |
Neutral | Stays within 196.17–204.58 | Range trade, buy near support, sell near resistance | 196.17 / 204.58 | High |
Aggressive traders may consider buying near 196.17 with a stop-loss at 192.00, targeting a move back to 204.00 if the range holds.
Conservative traders may wait for a clear breakout above 204.58 before entering new long positions, with a stop-loss at 200.00 and a target of 210.00.
Bearish scenario is validated only on a close below 182.88, which would shift the bias to negative.
6. Risk Management ⚠️
Risk no more than 1% of capital per trade.
Consider using ATR-based stops (2% of ATR) to account for volatility.
Monitor volume and price action closely, especially as earnings approach.
7. Weekly Outlook Summary 🗓️
NVDA is consolidating ahead of its Q1 earnings, with technical levels likely to dictate short-term moves. The stock is range-bound, and traders should watch for a breakout or breakdown from the current channel. The upcoming earnings call on May 20, 2026, is the next major catalyst. Until then, expect continued range trading with a neutral bias.
Disclaimer: This analysis is for informational purposes only and does not constitute financial advice. Please conduct your own research or consult a qualified professional before making trading decisions.

Julian Vance
Julian Vance is an independent writer and quantitative strategist. He writes about trading automation and account-management workflows for Copygram.
Join our newsletter list
Sign up to get the most recent blog articles in your email every week.

More Articles