Netflix (NFLX) Weekly Analysis & Outlook – Week 4 May 2026
Ideas
3 Min Read
In-depth weekly analysis for Netflix (NASDAQ:NFLX) – Week 4 May 2026. Includes technical chart review, latest news, support/resistance, and actionable trading scenarios.
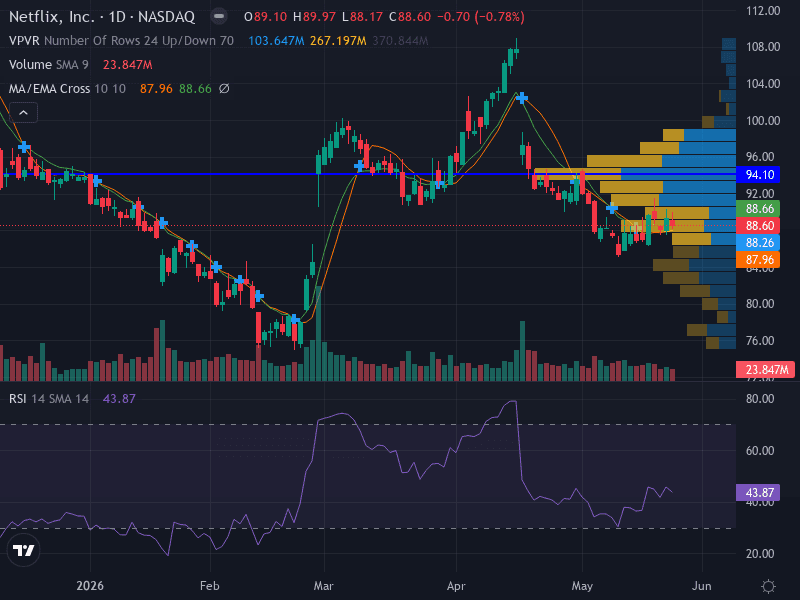
Welcome to the Netflix (NASDAQ:NFLX) Weekly Analysis for Week 4 of May 2026! This comprehensive blog post delivers a professional, actionable breakdown of NFLX’s technical chart, the latest news and catalysts, and a scenario-based outlook for the week ahead. Whether you’re a trader, investor, or market watcher, this analysis will help you navigate the current landscape with confidence. 🎬
📰 Latest News & Market Context
Q1 2026 Earnings Recap: Netflix reported Q1 EPS of $1.23 (vs. $0.79 est.) and revenue of $12.25B (slightly above $12.18B est.), but shares slipped as forward guidance disappointed. [Investing.com]
Guidance & Analyst Reaction: Q2 EPS guidance ($0.78) and margin outlook (32.6%) both trailed consensus. Analysts still see Netflix as a growth stock, but near-term pressure is expected due to expense timing and pricing rollouts. [YouTube]
Valuation & Macro Factors: Morningstar rates NFLX as moderately overvalued ($80 fair value), with ad-supported streaming, international growth, and consumer spending trends in focus. [Morningstar]
📈 Technical Analysis: Chart Structure & Key Levels
Aspect | Details |
|---|---|
Trend | Sideways/Neutral – Price consolidating near 9- and 10-day EMA, lacking clear direction. |
Pattern | Horizontal channel between recent swing highs (~$96.00) and lows (~$87.96). |
Support | Major: $88.26 |
Resistance | Major: $92.00 |
Momentum (RSI) | 43.87 – Neutral, slightly oversold, suggesting ongoing consolidation. |
Volume | Decreasing on recent moves, indicating lack of conviction and possible wait-and-see sentiment. |
MACD | Flat/neutral, confirming sideways price action. |
🔎 Chart Insights
Price is consolidating within a horizontal channel, with neither bulls nor bears in clear control.
Volume has declined during recent swings, suggesting traders are awaiting a catalyst.
MACD and RSI both reflect a neutral, indecisive market tone.
🧮 Fundamental & News Impact
Recent Earnings Beat: NFLX outperformed on Q1 2026 results, but the market’s focus has shifted to softer Q2 guidance and margin concerns.
Growth Levers: Ad-supported streaming, international expansion, and gaming are cited as long-term positives, but near-term expense ramp and pricing power are under scrutiny.
Valuation: With a 2-star rating from Morningstar and a fair value estimate below the current price, NFLX is considered moderately overvalued, increasing sensitivity to any negative surprises.
Macro Factors: Broader streaming competition, consumer spending trends, and interest rate moves remain sector-wide influences.
🔮 Possible Scenarios for Week 4 May 2026
Scenario | Trigger/Signal | Key Levels | Potential Action |
|---|---|---|---|
Bullish 🐂 | Breakout above $92.00 (major resistance) on strong volume | Entry: $92.10 | Consider long positions if price closes above $92.10 with volume confirmation. Watch for follow-through to $96.00. |
Bearish 🐻 | Breakdown below $87.96 (minor support) on high volume | Entry: Below $87.96 | Short setups may be considered if support fails decisively. Downside risk increases toward $84.00. |
Neutral/Range 🤝 | Price remains between $88.00 and $92.00 | Buy: $88.00–$88.60 | Range trading possible; fade extremes with tight stops. Wait for breakout confirmation before committing to trend trades. |
📋 Risk Management & Trade Ideas
Risk no more than 1% of capital per trade; adjust stops using ATR or volatility measures.
Monitor volume and price action at key levels for confirmation.
Be alert to any sudden news or sector moves that could break the current consolidation.
📅 What to Watch This Week
Any management commentary on ad monetization, pricing, or international growth.
Sector news: streaming competition, macroeconomic data, or consumer trends.
Price action at $92.00 (resistance) and $88.00 (support) – these are likely inflection points.
🔗 Useful Resources
This analysis is for informational purposes only and does not constitute investment advice. Please consult a qualified financial advisor before making trading decisions. Past performance is not indicative of future results.

Julian Vance
Julian Vance is an independent writer and quantitative strategist. He writes about trading automation and account-management workflows for Copygram.
Join our newsletter list
Sign up to get the most recent blog articles in your email every week.

More Articles