JPMorgan Chase (JPM) Weekly Analysis & Outlook – Week 2 May 2026
Ideas
3 Min Read
In-depth weekly analysis of JPMorgan Chase (JPM) for Week 2 May 2026: technical chart review, key news, support/resistance, volume, MACD, and actionable trading scenarios.
Welcome to our comprehensive weekly analysis of JPMorgan Chase (NYSE:JPM) for Week 2 of May 2026. This blog post delivers a detailed breakdown of JPM’s technical setup, recent news, and actionable scenarios for traders and investors. Our approach combines chart-based insights, news context, and scenario planning to help you navigate the week ahead. (Disclaimer: This post is for informational purposes only and does not constitute investment advice. Trading financial instruments involves risk.)
📰 Latest News & Catalysts (May 4–11, 2026)
Small Business Succession Initiative: JPMorgan Chase invested $11.5M to address the looming $10T small business succession crisis, funding programs to connect owners with successors. [Read more]
Debt Market Activity: JPMorgan priced $461K in Auto Callable Accelerated Barrier Notes due May 2029 and closed multi-billion dollar note offerings, raising $10B through strategic debt issuance. [SEC Filing] [Gurufocus]
Annual Meeting & Conference: The 2026 Annual Meeting of Shareholders is ongoing (questions accepted through May 13), and CEO Jamie Dimon is set to present at the Bernstein Strategic Decisions Conference. [Annual Meeting] [Conference]
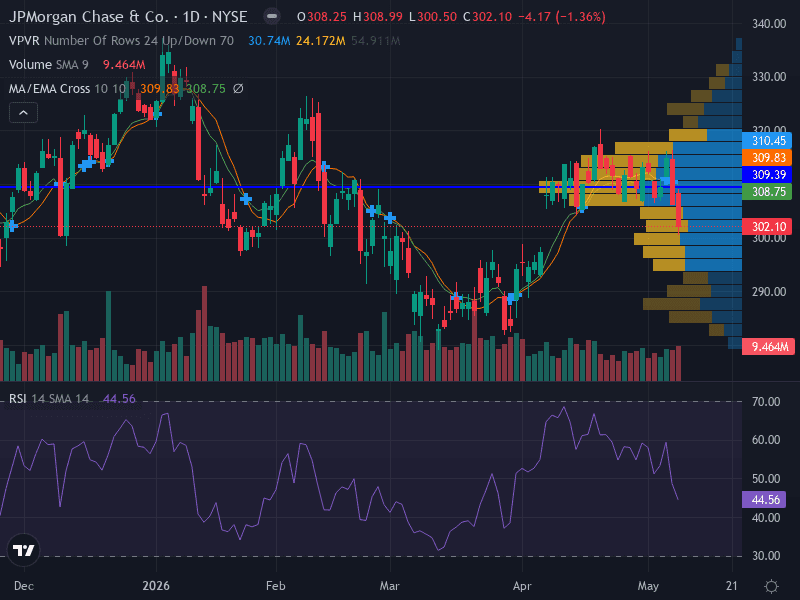
📈 Technical Analysis: Chart Structure & Indicators
Indicator | Current Reading | Interpretation |
|---|---|---|
Trend | Downtrend | Price below both 9-day & 21-day EMAs; confirms bearish momentum |
Pattern | Descending Triangle | Recent breakdown below consolidation area |
Support | 300.50 (major), 294.00 (minor) | Key levels to watch for potential bounces |
Resistance | 309.83 (major), 310.45 (minor) | Overhead supply; break above could shift bias |
RSI | 44.56 | Below 50, indicating bearish momentum |
Volume | Rising on down moves | Confirms strong selling pressure |
MACD | Bearish crossover | Momentum remains negative |
Summary: The technical picture for JPM this week is bearish. The price is trading below key moving averages and has broken down from a descending triangle pattern. Volume is increasing on down days, and the RSI remains below 50, suggesting further downside risk. MACD is negative, confirming momentum is with the bears.
🔎 Fundamental & News Impact
Strategic Initiatives: The $11.5M investment in small business succession programs is a long-term positive, but unlikely to move the stock in the short term.
Debt Issuance: Successful multi-billion dollar note offerings and new structured products reflect JPM’s strong access to capital markets and investor confidence in its credit profile.
Shareholder Engagement: The ongoing annual meeting and Jamie Dimon’s conference appearance may provide forward-looking commentary, but no immediate earnings or major analyst revisions are expected this week.
🧭 Actionable Scenarios for Week 2 May 2026
Scenario | Trigger/Signal | Key Levels | Potential Action |
|---|---|---|---|
🐻 Bearish | Price remains below 309.83; volume stays high on down moves | Support: 300.50, 294.00 | Consider short positions below 302.00; target 294.00; stop-loss above 310.50 |
🐂 Bullish | Break and close above 310.50 with strong volume | Resistance: 309.83, 310.45 | Consider long positions above 310.50; target 318.00; stop-loss below 309.00 |
⚖️ Neutral | Price consolidates between 300.50 and 309.83 | Range: 300.50–309.83 | Wait for breakout; avoid new positions until clear direction emerges |
Risk Management Tips
Risk only 0.5–1% of capital per trade.
Use ATR(14) for dynamic stop-loss placement.
Monitor volume and price action for confirmation before entering trades.
🔄 Weekly Outlook Summary
This week, JPMorgan Chase faces a technically bearish setup, with downside momentum confirmed by multiple indicators. While the company’s strategic initiatives and capital market activity show underlying strength, the short-term price action favors caution or bearish positioning unless a strong reversal above resistance occurs. Watch for any surprise headlines from the annual meeting or Jamie Dimon’s conference remarks, but otherwise, expect technicals to drive near-term moves.
Disclaimer: This analysis is for informational purposes only and does not constitute investment advice. Please consult your financial advisor before making trading decisions. All trading involves risk.

Julian Vance
Julian Vance is a quantitative strategist focused on algorithmic trading in crypto and futures. His work is dedicated to exploring how traders can leverage technology and data to gain a competitive edge.
Join our newsletter list
Sign up to get the most recent blog articles in your email every week.


More Articles


