Ethereum (ETHUSD) Weekly Analysis – Week 4 April 2026
Ideas
3 Min Read
In-depth weekly analysis of Ethereum (ETHUSD) for Week 4 April 2026. Explore technical levels, recent news, fundamental drivers, and actionable scenarios for traders. Includes chart, volume, MACD, and expert insights.
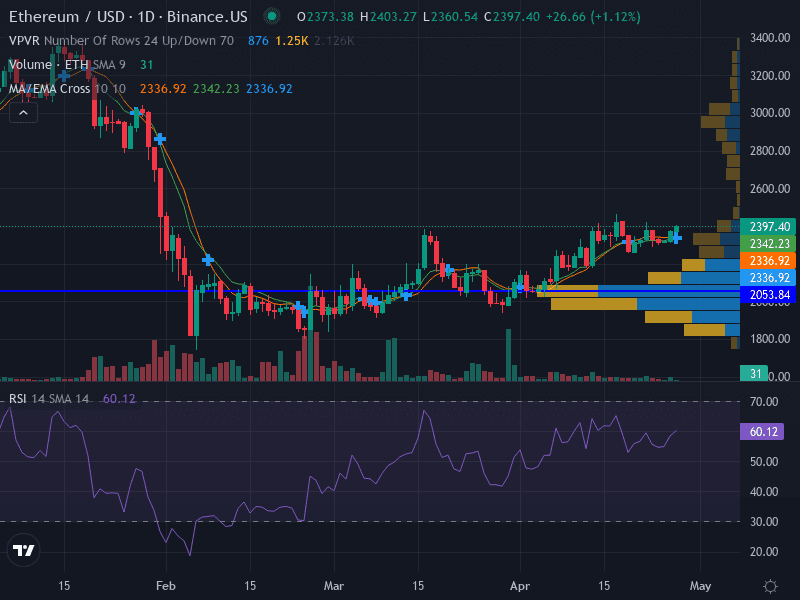
Welcome to our comprehensive Ethereum (ETHUSD) analysis for Week 4 of April 2026! This week, we dive deep into ETH’s technical structure, recent news, and actionable trading scenarios, equipping you with the insights needed for informed trading decisions. 🚀
Latest News & Macro Context (April 20–27, 2026)
Consolidation Amid Macro Uncertainty: Ethereum traded between $2,106 and $2,404, reflecting a period of sideways movement as the market digests ETF outflows and the final testing phase of the Pectra upgrade. (Fortune, MEXC)
Pectra Upgrade in Focus: The much-anticipated Prague-Electra (Pectra) upgrade is in its final test phase, promising improvements to network scaling and validator efficiency. This is drawing institutional attention, though price action remains muted for now. (YouTube)
ETF Outflows Continue: Spot ETH ETFs saw $77M in outflows in March, the fifth consecutive month, totaling $2.4B in outflows and contributing to the consolidation range. (MEXC)
Technical Analysis
Key Level | Type | Significance |
|---|---|---|
2,336.92 | Support (Major) | Primary consolidation floor |
2,053.84 | Support (Minor) | Secondary support if breakdown occurs |
2,397.40 | Resistance (Major) | Ceiling of current range |
2,500.00 | Resistance (Minor) | Potential breakout target |
Trend: Sideways. ETH is consolidating near the 9-EMA and 10-SMA, with no clear directional bias.
Momentum: RSI at 60.12 (neutral to slightly bullish). MACD histogram shows low momentum, indicating a lack of strong trend.
Pattern: Horizontal consolidation dominates, with no clear breakout or breakdown pattern yet.
Volume: Moderate, with no significant spikes, supporting the consolidation thesis.
Chart Structure & Interpretation
The daily chart confirms ETHUSD is in a well-defined range, oscillating between the major support at $2,336.92 and resistance at $2,397.40. The absence of strong volume surges or MACD crossovers suggests traders are waiting for a catalyst—likely the outcome of the Pectra upgrade or a shift in ETF flows.
Fundamental & News Impact
Pectra Upgrade: While the upgrade is a long-term bullish catalyst, its immediate price impact is muted as the market awaits successful deployment and measurable network improvements.
ETF Flows: Persistent outflows from spot ETH ETFs have weighed on sentiment, keeping ETH in a consolidation range despite broader crypto market resilience.
Macro Backdrop: Broader risk-off sentiment and recent recession fears have contributed to ETH’s inability to break out, even as Bitcoin holds above $75K.
Actionable Scenarios for Week 4 April 2026
Scenario | Trigger | Action | Target | Stop-Loss |
|---|---|---|---|---|
Bullish | Breakout above $2,397.40 | Buy on close above resistance | $2,500.00 | $2,336.92 |
Bearish | Breakdown below $2,336.92 | Sell/short on close below support | $2,053.84 | $2,397.40 |
Neutral | Range persists | Buy near $2,337, sell near $2,397 | $2,397.40 | $2,320.00 |
Risk Management: Limit risk to 0.5–1% of capital per trade. Use ATR (Average True Range) to set stops, as volatility may increase if a breakout or breakdown occurs.
Invalidation: A weekly close below $2,336.92 would invalidate the neutral/bullish thesis and suggest a move to a broader or lower range.
Summary Table: ETHUSD Week 4 April 2026
Aspect | Details |
|---|---|
Current Trend | Sideways, consolidation |
Major Support | $2,336.92 |
Major Resistance | $2,397.40 |
Key Catalyst | Pectra Upgrade, ETF flows |
Momentum | Neutral, low MACD |
Volume | Moderate |
Actionable Setup | Range trading, breakout watch |
Conclusion & Outlook
Ethereum’s price action for Week 4 April 2026 is defined by consolidation and indecision. Traders should watch for a decisive move outside the $2,336.92–$2,397.40 range, with the Pectra upgrade and ETF flows as primary catalysts. Until then, range trading strategies are favored, with tight risk controls and a readiness to adapt should volatility return. 📈
Disclaimer: This analysis is for informational purposes only and does not constitute investment advice. Always conduct your own research and consult a professional before trading.

Julian Vance
Julian Vance is an independent writer and quantitative strategist. He writes about trading automation and account-management workflows for Copygram.
Join our newsletter list
Sign up to get the most recent blog articles in your email every week.

More Articles