Ethereum (ETH/USD) Weekly Analysis – Week 1, January 2025 (Week 1)
Ideas
3 Min Read
Comprehensive Ethereum (ETH/USD) analysis for the week of December 29, 2025: price chart, technical levels, news, and actionable trading scenarios. Neutral trend, key support/resistance, and MACD insights for traders.
Welcome to the Ethereum (ETH/USD) Weekly Analysis for Week 1, January 2025 (Week 1)! This in-depth review covers the latest technical chart, key news, and actionable scenarios for ETH/USD as we enter the first week of January 2025. All data and analysis are based on the current week, starting December 29, 2025.
📊 Ethereum Price Chart Overview
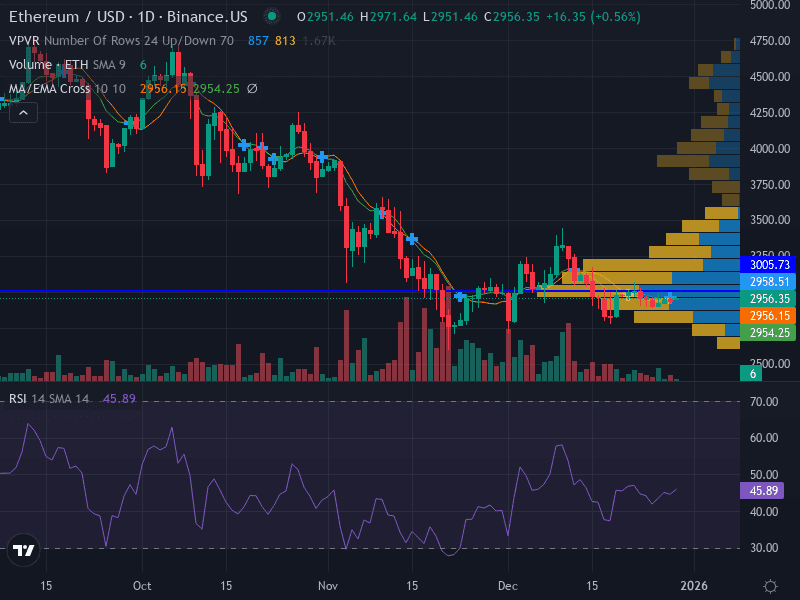
The chart for ETH/USD this week reveals a neutral, range-bound structure. Price is oscillating around the 10-day simple moving average (SMA), with momentum indicators (such as RSI and MACD) showing flat, indecisive signals. Volume has been decreasing on rallies, suggesting weak buying pressure. The price is consolidating between $2,900 and $3,050, with no clear breakout in either direction.
Key Technical Levels | Value (USD) | Significance |
|---|---|---|
Major Support | 2,956 | Horizontal support; recent lows |
Minor Support | 2,900 | Lower end of consolidation |
Minor Resistance | 3,005 | Near-term swing high |
Major Resistance | 3,050 | Recent swing high; top of range |
📰 Latest News & Short-Term Catalysts
Price Volatility & Consolidation: ETH/USD traded around $3,000–$3,049, with a market cap of $368B and 24h volume of $17.78B. The pair pressed resistance near $3,045–$3,080 after recovering above $2,980, supported by EMA50 and neutral RSI signals. (Economies.com)
Bearish Correction Risks: By the end of last week, ETH closed lower at $2,972, breaking below moving averages amid seller pressure, with forecasts suggesting a possible test of support near $2,405 before any rebound. (Forex24.pro)
Technical Compression & Indecision: The market is compressing near the 14-day EMA ($3,006), with neutral RSI (46.97) and bullish divergence indicating seller exhaustion. Key levels are resistance at $3,040–$3,085 and support at $2,940–$3,000. (DailyForex)
🔎 Technical Analysis
Trend: Sideways, with price hovering around the 10-day SMA and lacking clear direction.
Momentum: RSI at 45.89 (neutral), MACD flat, indicating a lack of strong directional momentum.
Pattern: Consolidation phase between $2,900 and $3,050; no clear breakout.
Volume: Decreasing on rallies, suggesting weak buying pressure and possible exhaustion of bulls.
Support & Resistance Table
Level | Type | Implication |
|---|---|---|
2,900 | Support | Break below may trigger further downside |
2,956 | Support | Major horizontal support; potential bounce zone |
3,005 | Resistance | Minor resistance; short-term profit-taking area |
3,050 | Resistance | Major resistance; breakout could trigger upside momentum |
📈 MACD & Volume Interpretation
MACD: Flat, confirming the lack of momentum and direction.
Volume: Lower on rallies, indicating weak conviction from buyers; volume spikes on dips suggest opportunistic buying but not sustained accumulation.
🧑💼 Fundamental & News Impact
No major Ethereum network upgrades, regulatory changes, or partnership announcements were reported in the past week. The price action was driven primarily by technical factors and broader market sentiment, with holiday trading volumes possibly contributing to the lack of direction. Crowded long positions (79%) raise the risk of a squeeze if support levels break.
🔮 Actionable Scenarios for the Upcoming Week
Scenario | Trigger | Action | Targets | Stop Loss |
|---|---|---|---|---|
Bullish | Break above $3,050 | Buy on breakout | 3150, 3220 | 3000 |
Bearish | Break below $2,900 | Sell on breakdown | 2850, 2750 | 2956 |
Neutral | Range-bound between $2,900–$3,050 | Wait for breakout; range-trade with tight stops | Sell near 3050, Buy near 2900 | ATR-based |
Aggressive traders may consider selling near $3,050 resistance (SL $3,100, target $2,900) if price rejects this level.
Conservative traders may wait for a confirmed breakout above $3,050 (buy $3,060, SL $3,000, target $3,150).
Invalidation: Sustained move above $3,100 would suggest a bullish breakout and invalidate the range-bound thesis.
⚖️ Risk Management
Risk no more than 1% of capital per trade.
Use ATR-based stops to account for volatility.
Monitor volume and momentum for early signs of breakout or breakdown.
📅 Timeframe Alignment
Both daily and intraday charts show choppy, range-bound trading, aligning with the neutral weekly view. Patience is warranted until a clear directional move emerges.
📝 Summary & Outlook
Ethereum (ETH/USD) enters the first week of January 2025 in a neutral, consolidation phase between $2,900 and $3,050. With no major news catalysts, technical levels and market sentiment will likely dictate price action. Traders should watch for a breakout from this range to signal the next directional move.
Disclaimer: This analysis is for informational purposes only and does not constitute investment advice. Please conduct your own research and consult a professional before making trading decisions.

Julian Vance
Julian Vance is a quantitative strategist focused on algorithmic trading in crypto and futures. His work is dedicated to exploring how traders can leverage technology and data to gain a competitive edge.
Join our newsletter list
Sign up to get the most recent blog articles in your email every week.


More Articles


