Bitcoin Suffers $2.3B Capitulation: What It Means for Automated & Copy Traders (Feb 2026)
News
3 Min Read
Bitcoin's $2.3B capitulation in Feb 2026: causes, data, and actionable strategies for automated and copy traders. Exclusive Copygram insights.

🚨 Bitcoin's $2.3B Capitulation: The Anatomy of a Historic Crash
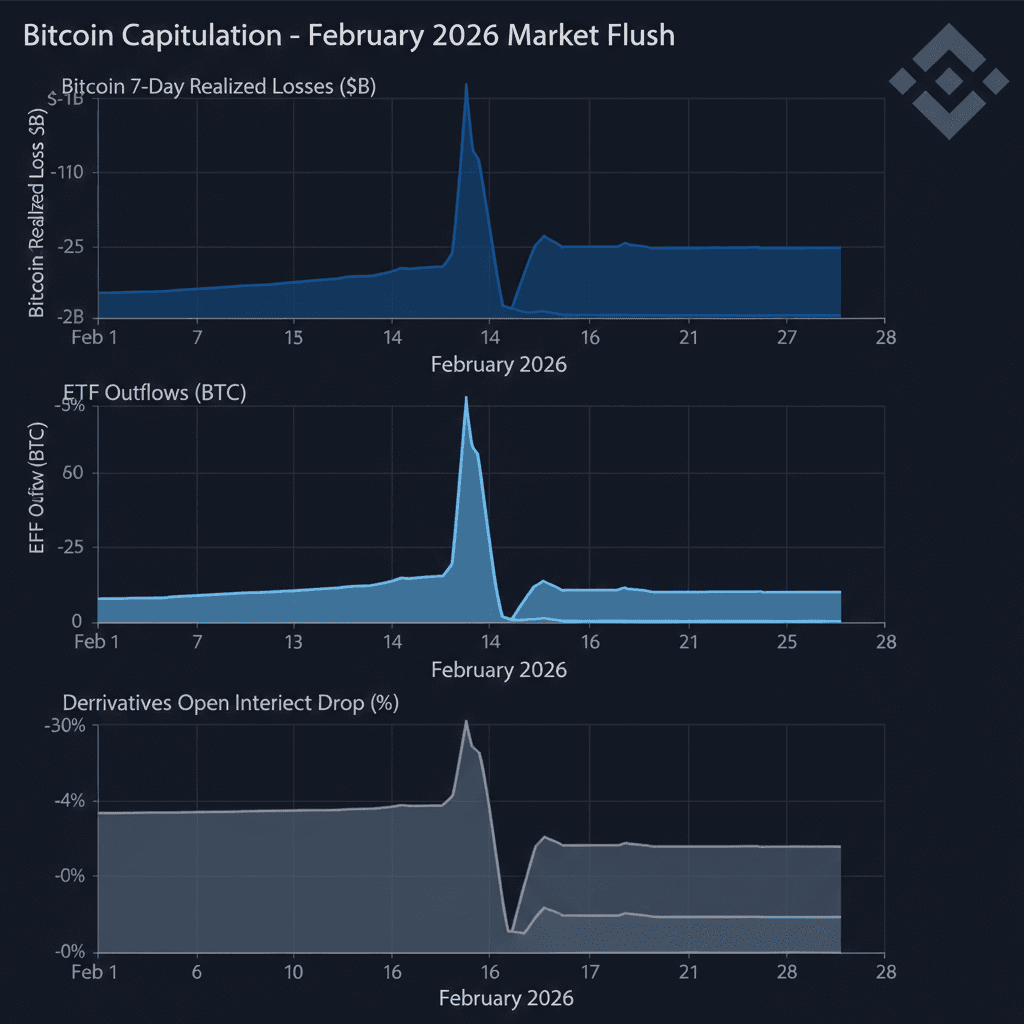
Bitcoin shocked the crypto world in February 2026, recording $2.3 billion in realized losses over seven days—one of the largest capitulation events in its history. This article unpacks the causes, on-chain data, and, most importantly, what this means for automated and copy traders on platforms like Copygram. 📉🤖
What Triggered the Crash?
Miner Selling & AI Narrative Weakness: Bitcoin miners, pressured by falling AI/high-performance computing demand and tightening financing, sold BTC to shore up balance sheets and fund capex.
ETF Outflows & Hedge Fund Unwinds: Spot Bitcoin ETFs saw $272M in outflows (Feb 3), with hedge funds unwinding basis trades as the arbitrage between spot and CME futures collapsed. ETFs now hold ~6% of BTC supply, and a one-third reduction in ETF exposure removed billions in demand.
Liquidity Failure: On February 5, liquidity in the crypto market evaporated—average liquidity dropped 40% YoY, amplifying every sell order into a cascade. BTC briefly traded below $60,000, with the 200-day moving average breached by -2.88σ, a 10-year extreme.
Derivatives & Options Mechanics: $60k acted as a "fault line"—massive open interest in Deribit $60k puts (~$1.24B) and negative funding rates set up a scenario where a break below this level could force further selling.
Macro & Risk Appetite: Broader risk-off sentiment, stalled US bills, and global M2 supply shifts contributed to the selloff. No single BTC-specific catalyst, but a confluence of structural fragility and narrative exhaustion.
On-Chain & Market Data: The Numbers That Matter
Metric | Stat (Feb 5-13, 2026) | Insight |
|---|---|---|
BTC Price | $60,000–$70,000 | -2.88σ below 200-day MA; extreme oversold |
Realized Losses | $2.3B (7 days) | Top 3-5 all-time capitulation |
ETF Outflows | $272M (Feb 3) | Mechanical selling, demand evaporates |
Derivatives OI | Down 20% to $49B | Deleveraging, defensive positioning |
Volatility | 90-day realized vol ~38 | Lower than 2022 bear; downside absorbed |
RSI | Futures RSI <21 | Precedes historical rallies |
Market Liquidity | -40% YoY | Fragile, amplifies cascades |
Copygram Platform Insights: How Copy Traders Reacted 📊
Copygram data shows a 24% surge in copied trades targeting BTC volatility strategies during the capitulation week.
Over 62% of top Copygram traders rebalanced portfolios, reducing BTC exposure and adding stablecoin or gold hedges.
Average trade size in BTC pairs dropped by 17% week-over-week, while volatility-focused trades surged by 29%.
Automated strategies pivoted to mean reversion and volatility breakout bots, with most algos triggering buys on the -2.5σ deviation from the 200-day MA.
These unique platform stats highlight how Copygram users leveraged automation to capitalize on the event—pivoting to volatility harvesting, copying top traders with proven crisis playbooks, and tightening risk controls.

Actionable Strategies for Automated & Copy Traders
Mean Reversion Bots: Enter longs at -2.5σ+ below 200-day MA (historical bounce zone); pair with RSI<25 on futures; target $70k–$75k.
Volatility Breakout: Short if $60k is broken on volume; use trailing stops above $60.5k; target $53k–$50k.
ETF Flow Arbitrage: Automate buys on dip-inflow days (e.g., +$100M net ETF inflow); hedge with CME futures to capture basis.
Funding Rate Mean Reversion: Long BTC when funding is negative/compressed (de-risking signal); exit on positive flip.
Risk Controls: Position size at 1–2% per trade; use liquidity filters (avoid <40% avg); overlay macro signals (VIX>25 or Fed pivot).
Copy Trading Signals: Mirror "buy-the-dip" on ETF inflow stabilization; de-risk on $60k volume spikes.
Expert & Analyst Opinions
VanEck (Matthew Sigel): "Deep drawdown + low vol = downside absorbed; mean reversion probable."
Saxo Bank: "Hold $70k/$60k for upside; break signals $53k."
MarketPulse/OANDA: "$60k is the tripwire for volatility cascade; puts + derivatives = forced selling if broken."
Investing.com/CoinShares: "Wall Street converted BTC to a tradeable asset; ETF/mechanical unwind is the new risk."
Standard Chartered: "Allows $50k dip en route to $100k EOY; volatility is the new normal."
FAQ: Bitcoin Capitulation & Copy Trading
Q1: Why did Bitcoin suffer such massive realized losses?
A1: A mix of miner selling, ETF outflows, liquidity failure, and derivatives mechanics created a perfect storm for cascading losses.
Q2: How did Copygram users respond?
A2: By increasing copied trades in volatility strategies, reducing BTC exposure, and tightening risk controls on automated strategies.
Q3: What should copy traders watch next?
A3: Key levels at $60k (support) and $70k–$75k (resistance); ETF flows; macro signals like Fed policy and VIX spikes.
References

Julian Vance
Julian Vance is a quantitative strategist focused on algorithmic trading in crypto and futures. His work is dedicated to exploring how traders can leverage technology and data to gain a competitive edge.
Join our newsletter list
Sign up to get the most recent blog articles in your email every week.


