BTCUSD Weekly Technical & News Analysis – Week 1 May 2026
Ideas
3 Min Read
In-depth BTCUSD analysis for Week 1 May 2026: price chart, technicals, news, macro events, and actionable trading scenarios. Stay informed on Bitcoin's next move.
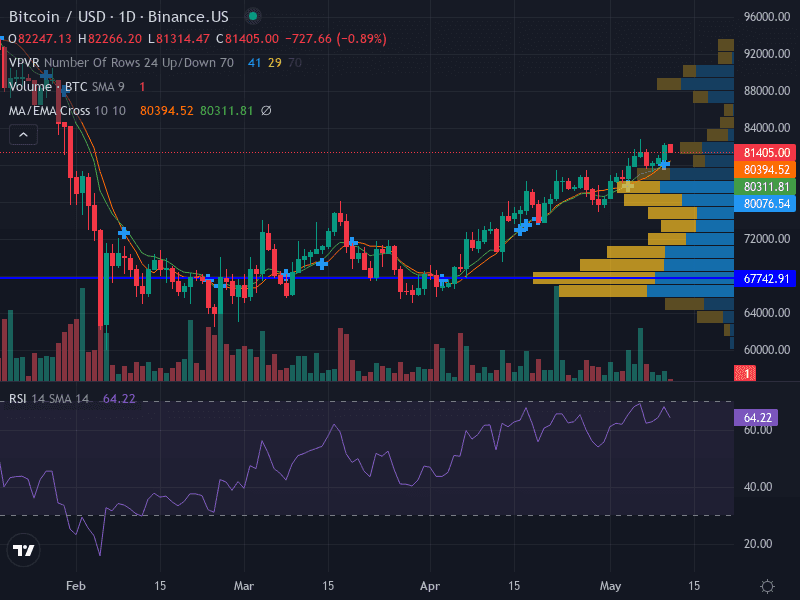
Bitcoin (BTCUSD) enters Week 1 of May 2026 with bullish momentum, trading above key moving averages and holding near major resistance. This comprehensive analysis covers the latest price action, technical signals, macroeconomic news, and actionable trading scenarios for the upcoming week. All data and analysis are as of May 11, 2026.
📈 Price Chart Overview
Trend: Uptrend – Price above 10-day and 50-day moving averages, forming higher highs.
Support: $80,076 (major), $67,742 (major – previous swing low).
Resistance: $81,405 (major – recent swing high).
Momentum: RSI at 64.22 (bullish, but approaching overbought), MACD confirms bullish momentum.
Volume: Increasing on upward moves, indicating strong buying interest.
📰 Latest News & Catalysts (May 4–10, 2026)
Event | Impact on BTC | Source |
|---|---|---|
ETF Flows & Liquidations | BTC saw $507M in spot ETF inflows (BlackRock leads), but outflows triggered caution. $66M–$91M in short/long liquidations caused volatility. | |
Geopolitical Tensions | Oil price swings and Iran’s Hormuz control claim drove risk-off moves; Trump’s Russia-Ukraine ceasefire announcement helped BTC reclaim $80k. | |
Macroeconomic Data | Strong US jobs data and US PPI inflation at 2.9% pressured BTC below $80k, but market followed Wall Street rally on options boom. |
🔎 Technical Analysis
Support Levels: $80,076 (primary), $67,742 (secondary).
Resistance Levels: $81,405 (primary), $84,766 (bullish trigger).
Pattern: Ascending trend, no clear breakdown. Price consolidates near highs, suggesting possible breakout or pullback.
MACD: Bullish crossover, supporting upward momentum.
Volume: Notably higher on upward moves, confirming strong buyer interest.
RSI: 64.22 – bullish but nearing overbought territory, so watch for potential exhaustion.
Technical Table
Indicator | Value | Interpretation |
|---|---|---|
10-day MA | Above price | Bullish |
50-day MA | Above price | Bullish |
MACD | Bullish crossover | Momentum up |
RSI | 64.22 | Approaching overbought |
Volume | Rising | Strong buying |
🧭 Fundamental & News Impact
ETF Flows: Sustained inflows into spot BTC ETFs support the bullish case, but outflows and liquidations can trigger sharp reversals.
Macro Events: US jobs and inflation data, oil volatility, and geopolitical headlines (Iran, Russia-Ukraine) are driving short-term swings.
Institutional Moves: MicroStrategy and other corporates remain net buyers, but some miners report losses despite high BTC prices.
Altcoin Rotation: Surges in Zcash, Toncoin, and XRP may siphon some speculative capital from BTC, but overall crypto sentiment remains constructive.
📊 Scenario Outlook for Week 1 May 2026
Scenario | Trigger | Price Levels | Probability | Actionable Idea |
|---|---|---|---|---|
🐂 Bullish | Breakout above $81,405 | Target $84,000–$85,000 | Medium-High | Buy breakout, SL $78,800 |
🐻 Bearish | Breakdown below $80,076 | Target $77,500–$75,000 | Medium | Sell breakdown, SL $81,500 |
⚖️ Neutral | Range $80,076–$81,405 | Chop between support/resistance | Medium | Wait for clear breakout or breakdown |
Trade Management & Risk
Risk 1% of capital per trade; use ATR-based stops for dynamic adjustment.
Monitor ETF flows, macro headlines, and volume spikes for early warning signals.
Be prepared for volatility around geopolitical or economic news releases.
🔔 Key Takeaways
BTCUSD is in a clear uptrend, but faces resistance near $81,405. A breakout could target $84,000–$85,000, while a breakdown below $80,076 risks a move to $77,500 or lower.
ETF flows, macroeconomic data, and geopolitical headlines are the main catalysts this week.
Traders should remain flexible and manage risk carefully, as volatility is likely to persist.
Disclaimer: This analysis is for informational purposes only and does not constitute investment advice. Please consult a professional before making trading decisions.

Julian Vance
Julian Vance is an independent writer and quantitative strategist. He writes about trading automation and account-management workflows for Copygram.
Join our newsletter list
Sign up to get the most recent blog articles in your email every week.

More Articles