Bitcoin (BTCUSD) Weekly Analysis & Outlook – Week 1 December 2025
Ideas
3 Min Read
Comprehensive weekly analysis of Bitcoin (BTCUSD) for Week 1, December 2025. Includes technical chart review, latest news, support/resistance, MACD, volume, and actionable trading scenarios.
Welcome to our in-depth weekly analysis of Bitcoin (BTCUSD) for Week 1 of December 2025. This report provides a comprehensive review of the latest price action, technical and fundamental drivers, and actionable scenarios for traders and investors. 📈💡
1. Executive Summary
Bearish momentum dominates Bitcoin’s technical landscape this week. The price is trading below key moving averages, with a falling RSI and a possible descending triangle pattern. Recent news highlights macroeconomic uncertainty, especially around the Federal Reserve’s December meeting, and seasonal factors that could influence volatility. Let’s break down the details.
2. Latest News & Market Catalysts (Past 7 Days)
Headline | Summary | Source |
|---|---|---|
Bitcoin rebounds above $85,000; Fed’s Waller supports December rate cut | Bitcoin recovered from recent lows, trading above $85,000, as expectations of a Federal Reserve rate cut in December lifted risk assets. However, the rally has been muted compared to previous cycles. | |
December’s historical 20% holiday rally in focus | Seasonal trends suggest December could bring a strong rally, but November’s 21% decline raises doubts about whether this pattern will repeat in 2025. | |
Bitcoin faces macro, regulatory, and competition headwinds | Despite some institutional accumulation, Bitcoin remains vulnerable to macroeconomic uncertainty, regulatory scrutiny, and competition from other digital assets. |
3. Technical Analysis
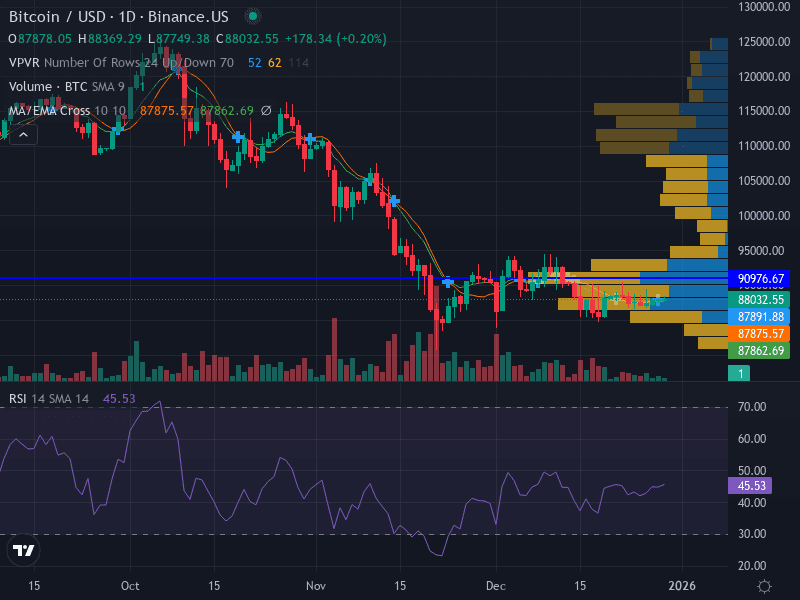
Trend: Downtrend — Price is below both the 10-day and 50-day moving averages, forming clear lower highs and lower lows.
Support Levels:
Major: $87,000 (recent low)
Minor: $85,000
Resistance Levels:
Major: $90,000 (psychological and EMA)
Minor: $92,000
Momentum: RSI at 34.64 (bearish, approaching oversold territory). MACD histogram likely negative, confirming bearish momentum.
Pattern: Possible descending triangle forming, with recent bounces off lower support.
Volume: Increasing on declines, reducing on rebounds — a classic sign of bearish pressure.
Chart Structure & Interpretation
The current chart structure suggests a high probability of further downside unless Bitcoin can reclaim the $90,000–$92,000 resistance zone. The descending triangle pattern, combined with bearish volume dynamics, points to continued selling pressure. If support at $87,000 fails, a move toward $85,000 or even $83,000 is likely.
4. Fundamental & News Impact
Macro Drivers: The main catalyst is the upcoming Federal Reserve meeting. A rate cut could provide a short-term boost, but the expected 25bps cut may not be enough to reverse the bearish trend if broader risk sentiment remains cautious.
Seasonality: Historically, December has delivered strong rallies for Bitcoin, averaging 20%. However, this year’s weak November and macro headwinds could dampen the effect.
Institutional Activity: Increased ETF inflows and whale accumulation at lower prices suggest some confidence in a rebound, but retail participation is still low.
Risks: Delays or disappointment in Fed policy, regulatory actions, or a shift in global risk appetite could trigger further declines.
5. Actionable Scenarios for the Upcoming Week
Scenario | Key Levels | Actionable Plan | Probability |
|---|---|---|---|
Bullish | Break and close above $92,000 | Look for confirmation of reversal (e.g., strong volume, bullish MACD crossover). Enter long above $92,200, stop-loss at $89,000, target $96,000. | Low to Moderate |
Bearish | Break below $87,000 | Sell at $86,800, stop-loss at $89,000, target $83,000. Alternatively, sell on rejection at $89,000 resistance, stop-loss at $91,000, target $85,000. | Moderate to High |
Neutral/Range | $87,000–$90,000 | Wait for breakout confirmation. Avoid new positions unless price closes outside this range with strong momentum. | Moderate |
6. Risk Management & Trade Ideas
Risk only 0.5–1% of capital per trade.
Use ATR (14-day) to set dynamic stop-losses based on volatility.
Monitor Fed policy updates and macro headlines closely.
Be prepared for higher volatility around the Fed meeting and year-end flows.
7. Conclusion & Outlook
Bitcoin enters December 2025 with a bearish technical bias, pressured by macro uncertainty and cautious sentiment. While a seasonal rally is possible, the path of least resistance remains to the downside unless key resistance levels are reclaimed. Traders should stay nimble, manage risk tightly, and watch for confirmation from both price action and macro news.
Disclaimer: This analysis is for informational purposes only and does not constitute investment advice. Please conduct your own research and consult a professional before making trading decisions.

Julian Vance
Julian Vance is a quantitative strategist focused on algorithmic trading in crypto and futures. His work is dedicated to exploring how traders can leverage technology and data to gain a competitive edge.
Join our newsletter list
Sign up to get the most recent blog articles in your email every week.


More Articles


