Amazon (AMZN) Weekly Analysis & Outlook – Week 1, December 2025
Ideas
3 Min Read
In-depth analysis of Amazon (NASDAQ:AMZN) for Week 1, December 2025: technical chart, key support/resistance, MACD, volume, news, and actionable trading scenarios.
Welcome to our comprehensive weekly analysis of Amazon (NASDAQ:AMZN) for Week 1, December 2025. This blog post delivers a world-class, actionable review of AMZN’s technicals, recent news, and potential scenarios for the week ahead. Whether you’re a trader, investor, or market observer, our breakdown will help you navigate the current landscape with clarity. 📊
Summary of the Current Technical Landscape
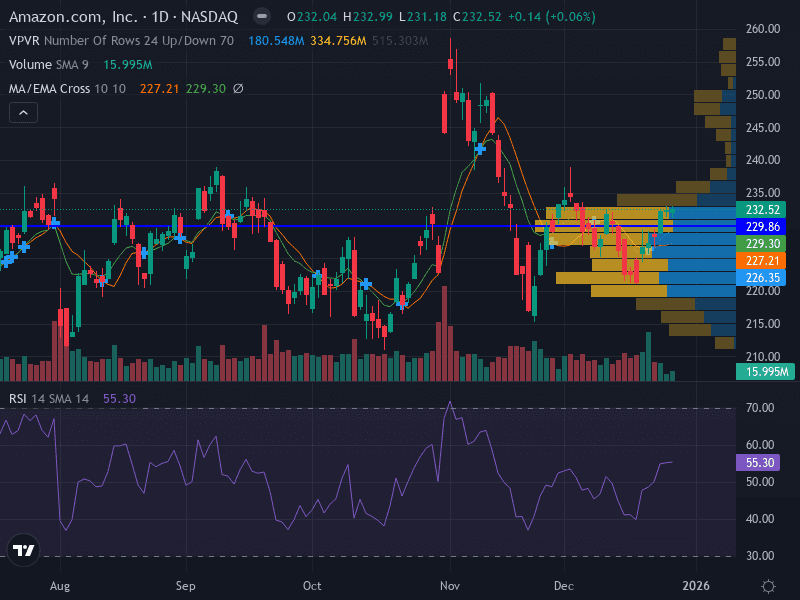
Amazon’s price action this week is characterized by neutral consolidation around its moving averages, with no clear breakout direction. The stock closed at $232.52 on December 26, 2025, up 0.06% from the previous session, and has been trading in a tight range between support at $226.35–$229.86 and resistance at $232.52–$235.00. Volume has been subdued, especially on declines, but is showing slight increases on recent rises. The MACD hovers near the zero line, indicating a lack of momentum, while RSI sits at 55.3, reflecting a slightly bullish but overall neutral stance.
Key Technical Levels | Current Value |
|---|---|
Major Support | $226.35 |
Minor Support | $229.86 |
Major Resistance | $232.52 |
Minor Resistance | $235.00 |
RSI (14) | 55.30 |
MACD | Near zero line |
Latest News & Short-Term Catalysts (Past 7 Days)
Price Action: AMZN closed at $232.52 on December 26, 2025, with a weekly gain of about 1.8%. Trading volumes were lower than average, likely due to the holiday-shortened week. [Source]
No Major News: No significant company-specific headlines or macro events directly impacted AMZN during the week. The only notable mention was an unconfirmed report about Amazon halting drone delivery plans in Italy, but this did not affect price action. [Source]
Analyst Sentiment: Remains strongly positive, with 96% of 74 analyst ratings as Buy. No new analyst notes or earnings updates were released in the past week. [Source]
Technical Analysis
Trend: Sideways. Price is consolidating between the 10- and 20-week EMAs, with no distinct up or down trend.
Momentum: Neutral to slightly bullish. RSI at 55.3 and MACD near zero suggest a lack of strong directional momentum.
Pattern: Horizontal consolidation, with a potential double bottom forming near $229.00.
Volume: Lower on declines, slightly increasing on recent rises, indicating cautious accumulation.
Volume & MACD Interpretation
The subdued volume during declines and the slight uptick during price rises hint at cautious optimism among buyers. However, the MACD’s position near the zero line confirms that neither bulls nor bears have seized control. This aligns with the observed sideways price action and the lack of a clear breakout or breakdown.
Fundamental & News Impact
Financials: Amazon’s last reported quarter (Q1 2025) showed net sales up 9% to $155.7 billion. The next earnings date is not yet scheduled. [Source]
Macro Environment: The holiday-shortened week contributed to lower volumes. No major macroeconomic events or Fed announcements directly impacted AMZN during this period.
Valuation & Sentiment: AMZN trades at a P/E of 32.85, with a market cap of $2.49 trillion. Analyst sentiment remains overwhelmingly bullish, but the lack of fresh news or earnings means price action is driven mainly by technical factors this week.
Actionable Scenarios for the Upcoming Week
Scenario | Trigger | Action | Key Levels | Probability |
|---|---|---|---|---|
📈 Bullish | Breakout above $232.52 | Buy on breakout, SL $229.50, Target $235.00 | $232.52 (entry), $235.00 (target) | Moderate |
📉 Bearish | Weekly close below $226.35 | Sell/short, SL $229.00, Target $222.00 | $226.35 (breakdown), $222.00 (target) | Low |
🤝 Neutral/Range | Price remains between $229.86–$232.52 | Range trade, buy near support, sell near resistance | $229.86 (support), $232.52 (resistance) | High |
Trade Management & Risk
Consider risking no more than 1% of capital per trade.
Use ATR-based stops to adjust for volatility.
Monitor for any news catalysts or earnings announcements that could shift sentiment.
Summary Table: Amazon (AMZN) Weekly Outlook
Factor | Current Status |
|---|---|
Trend | Sideways/Neutral |
Momentum | Neutral (RSI 55.3, MACD flat) |
Support | $226.35, $229.86 |
Resistance | $232.52, $235.00 |
Volume | Subdued, slightly rising on up moves |
News | No major headlines this week |
Analyst Sentiment | Strongly positive (96% Buy) |
Conclusion
Amazon (AMZN) enters the first week of December 2025 in a state of technical equilibrium, with price consolidating near key moving averages and no major news to drive direction. Traders should watch for a breakout above $232.52 for a potential bullish move, or a breakdown below $226.35 for a bearish scenario, but the most probable outcome is continued range-bound trading. Stay alert for any unexpected news or macro shifts that could disrupt this balance. 🚦
Disclaimer: This analysis is for informational purposes only and does not constitute financial advice. Please conduct your own research or consult a professional before making investment decisions.

Julian Vance
Julian Vance is a quantitative strategist focused on algorithmic trading in crypto and futures. His work is dedicated to exploring how traders can leverage technology and data to gain a competitive edge.
Join our newsletter list
Sign up to get the most recent blog articles in your email every week.


More Articles


