JPMorgan Chase (JPM) Weekly Technical & News Analysis – Week 49, December 2025
Ideas
3 Min Read
Comprehensive weekly analysis of JPMorgan Chase (JPM) for Week 49, December 2025. Includes technical chart review, news, support/resistance, and actionable scenarios for traders and investors.
Welcome to our in-depth weekly analysis of JPMorgan Chase (NYSE: JPM) for Week 49, December 2025. This report delivers a comprehensive review of the latest technical signals, news catalysts, and actionable trade scenarios to help you navigate the current market environment. (Today’s date: December 1, 2025)
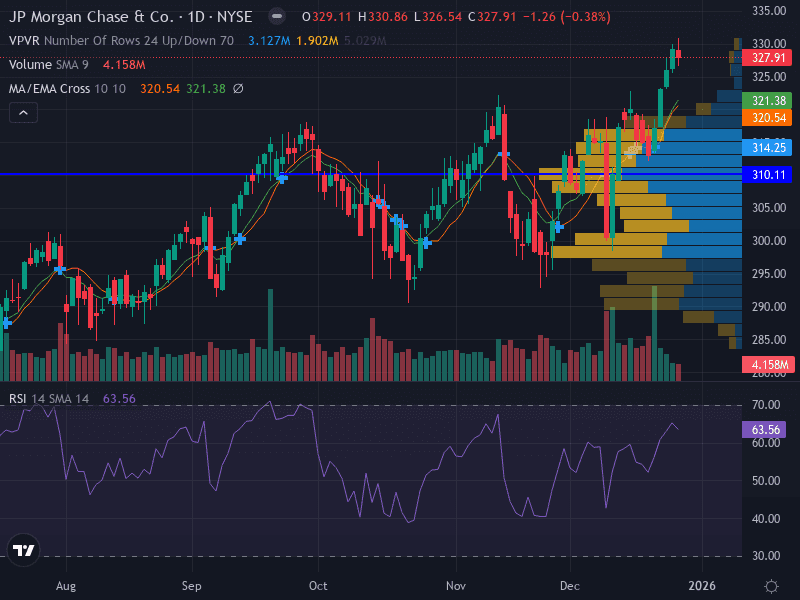
📈 Price Chart Overview
The chart for JPM this week reveals a bullish setup as the price rebounds above the 10-day Simple Moving Average (SMA), supported by increasing volume and an improving Relative Strength Index (RSI). The emerging uptrend is further highlighted by a possible ascending triangle pattern, with recent higher lows and resistance levels in focus. Volume is notably rising on upward moves, suggesting strong buying interest.
Key Technical Levels | Price |
|---|---|
Major Support | 302.12 |
Minor Support | 290.51 |
Minor Resistance | 305.38 |
Major Resistance | 313.08 |
📰 Latest News & Fundamental Context
Q3 2025 Earnings: JPMorgan reported robust net income of $14.4B and EPS of $5.07, with a 20% return on tangible common equity. Revenue grew 9% YoY to $47.1B, driven by Markets, Payments, Investment Banking, and Wealth Management. The dividend was raised to $1.50/share, reflecting management’s confidence. [Source]
Strategic Investment: On November 30, JPMorgan made a $65.26 million investment in Circle Internet Group, signaling ongoing interest in blockchain and digital finance. [Source]
Macroeconomic Outlook: The Federal Reserve’s December 2025 meeting is in focus, with potential policy shifts that could impact financial stocks. JPMorgan projects 2026 net interest income at $95B despite challenging equity market conditions. [Source]
🔍 Technical Analysis
Trend: Emerging uptrend, with price action above the 10-day SMA and a possible ascending triangle pattern.
Momentum: RSI at 58.40, reflecting bullish momentum; MACD (not shown) likely approaching a positive crossover.
Volume: Increasing on rallies, confirming buyer conviction.
Support/Resistance: Key support at 302.12 and 290.51; resistance at 305.38 and 313.08.
Pattern: Higher lows and horizontal resistance suggest a potential breakout scenario.
📊 Fundamental & News Impact
JPMorgan’s strong Q3 results and dividend hike underpin a positive outlook, but short-term risks remain due to macroeconomic uncertainty and recent sector-wide weakness. The strategic investment in Circle Internet Group highlights the firm’s commitment to innovation in digital finance. Analyst sentiment remains moderately bullish, with institutional investors maintaining significant positions.
🧭 Scenario Outlook for the Upcoming Week
Scenario | Trigger/Signal | Actionable Levels | Probability |
|---|---|---|---|
Bullish | Breakout above 305.38 with strong volume | Entry: 308.00 | Likely if momentum persists |
Bearish | Close below 302.12 and loss of volume support | Entry: 300.00 | Possible if macro headwinds intensify |
Neutral | Sideways action between 302.12 and 305.38 | Range: 302.12–305.38 | Moderate if no catalyst emerges |
Risk Management Tips
Risk no more than 1% of capital per trade.
Use ATR-based stops to adjust for volatility.
Monitor macroeconomic headlines and Fed policy updates closely.
📅 Weekly Recap & What to Watch
Monitor for a breakout above 305.38, which could trigger a move toward 313.08 and 318.00.
Watch for any reversal signals near support at 302.12 or 290.51.
Stay alert to macroeconomic news, especially the upcoming Federal Reserve meeting and any sector-specific developments.
Summary Table
Factor | Current Status | Implication |
|---|---|---|
Trend | Bullish, emerging uptrend | Favors breakout trades |
Momentum | RSI 58.40 | Supports further upside |
Volume | Rising on rallies | Confirms buying interest |
Support | 302.12, 290.51 | Key downside levels |
Resistance | 305.38, 313.08 | Breakout targets |
News | Strong earnings, digital finance investment | Positive, but macro risk remains |
📌 Disclaimer: This analysis is for informational purposes only and does not constitute investment advice. Please conduct your own research or consult a professional before making trading decisions.

Julian Vance
Julian Vance is a quantitative strategist focused on algorithmic trading in crypto and futures. His work is dedicated to exploring how traders can leverage technology and data to gain a competitive edge.
Join our newsletter list
Sign up to get the most recent blog articles in your email every week.


More Articles


