Netflix (NFLX) Weekly Analysis & Outlook – Week 50 December 2025
Ideas
3 Min Read
In-depth weekly analysis of Netflix (NASDAQ:NFLX) for the week of December 8, 2025. Includes technical chart, support/resistance, news impact, and actionable trading scenarios.
Welcome to our comprehensive weekly analysis of Netflix (NASDAQ:NFLX) for the week of December 8, 2025 (Week 50). This post provides a deep dive into the technical and fundamental landscape for NFLX, helping traders and investors navigate the current market environment with actionable insights. 📈
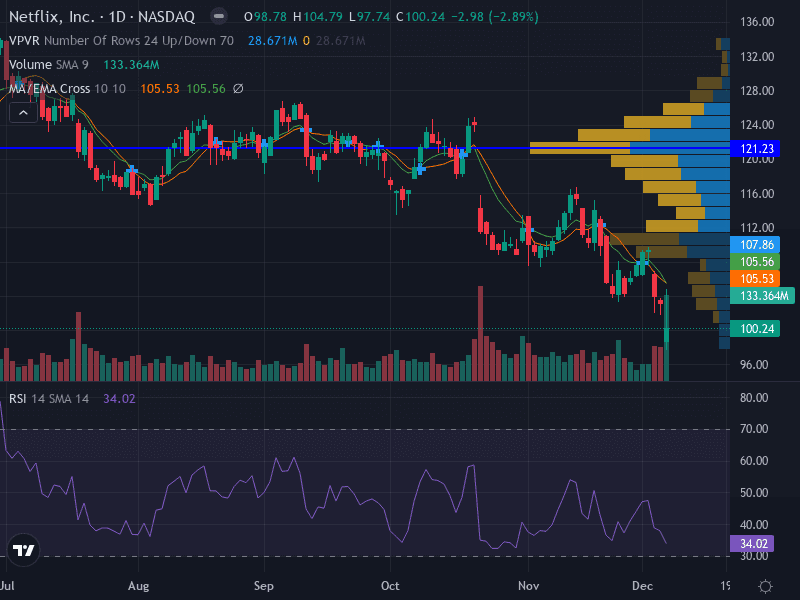
📊 Netflix (NFLX) Weekly Price Chart Overview
The chart below (not shown here) illustrates NFLX’s performance over the past several weeks, highlighting key technical signals and volume trends. The price action remains bearish, with the stock trading below both its 10- and 50-day EMAs and forming a clear descending channel. Volume has increased on recent downward moves, underscoring persistent selling pressure. The MACD histogram is below zero, confirming negative momentum.
Indicator | Current Reading | Interpretation |
|---|---|---|
Trend | Downtrend | Price below 10 & 50 EMA; lower lows |
Support | 97.00 (major), 94.00 (minor) | Potential bounce zones |
Resistance | 107.86 (major), 105.53 (minor) | Likely sell zones |
RSI | 34.02 | Bearish, approaching oversold |
MACD | Histogram below zero | Bearish momentum |
Volume | Increasing on down moves | Strong selling pressure |
📰 Latest News & Fundamental Context
No major news or earnings releases for Netflix in the past 7 days. The latest updates from Netflix’s investor relations were in June 2025, including board appointments and expansion plans for Netflix Houses in Philadelphia, Dallas, and Las Vegas. [Source]
Macro context: The absence of fresh news means price action is likely driven by technical factors and broader market sentiment this week.
Upcoming catalysts: None identified for the current week. Traders should monitor for any surprise headlines or sector-wide moves.
🔎 Technical Analysis
Trend: NFLX remains in a pronounced downtrend, with price action contained within a descending channel. Both the 10- and 50-day EMAs act as dynamic resistance, and the stock continues to print lower highs and lower lows.
Support Levels: The primary support is at $97.00 (recent swing low), with a secondary level at $94.00. These are potential bounce zones if selling exhausts.
Resistance Levels: Immediate resistance is at $105.53 (minor) and $107.86 (major, EMA confluence). A close above $107.86 would challenge the bearish structure.
Momentum: The RSI at 34.02 is bearish and nearing oversold territory, suggesting downside could slow if buyers step in. The MACD histogram remains negative, confirming the prevailing bearish momentum.
Volume: Notably, volume has increased on recent down moves, indicating that sellers remain in control. Watch for any volume spikes at support or resistance for signs of reversal or continuation.
Pattern: The descending channel structure is intact. A break below $97.00 could accelerate the downtrend, while a breakout above $107.86 would be an early sign of reversal.
🧮 Fundamental & News Impact
With no major news or earnings this week, NFLX’s price is likely to be dictated by technical flows and overall market risk appetite. The June 2025 announcement of Netflix House expansions and board changes are longer-term themes and not immediate trading catalysts. The lack of fresh headlines increases the probability that technical levels will dominate short-term price action.
📅 Scenarios & Actionable Outlook for Week 50 (December 8–14, 2025)
Scenario | Trigger | Potential Move | Key Levels | Risk Management |
|---|---|---|---|---|
Bullish 🟢 | Break & close above $107.86 | Potential reversal, target $112.00–$115.00 | 107.86 (breakout), 112.00 (target) | Use tight stop below 105.50 |
Bearish 🔴 | Rejection at $105.53–$107.86 or break below $97.00 | Downside continuation, target $94.00 | 105.53/107.86 (resistance), 97.00/94.00 (support) | Stop above 108.00 (short), risk 0.5–1% capital |
Neutral 🟡 | Range-bound between $97.00 and $107.86 | Choppy action, fade extremes | 97.00 (support), 107.86 (resistance) | Wait for breakout or breakdown |
Trade Ideas for This Week
Aggressive: Consider shorting near $105.50 (EMA resistance), stop-loss at $108.00, target $97.00. Rationale: EMA resistance and continuation of downtrend.
Conservative: Wait for a break below $97.00, short at $96.50, stop-loss at $100.00, target $94.00.
Invalidation: A weekly close above $107.86 would suggest a potential trend reversal and invalidate the bearish thesis.
⚠️ Risk Management & Final Thoughts
Risk only 0.5–1% of capital per trade.
Use ATR(14) for precise stop-loss placement.
Monitor volume and price action at key levels for clues on direction.
Stay alert for any surprise news or sector-wide moves that could impact NFLX.
Disclaimer: This analysis is for informational purposes only and does not constitute financial advice. Please conduct your own research and consult with a professional before making trading decisions.

Julian Vance
Julian Vance is a quantitative strategist focused on algorithmic trading in crypto and futures. His work is dedicated to exploring how traders can leverage technology and data to gain a competitive edge.
Join our newsletter list
Sign up to get the most recent blog articles in your email every week.


More Articles


