Microsoft (MSFT) Weekly Technical & News Analysis – Week 51, December 2025
Ideas
3 Min Read
Comprehensive weekly analysis for Microsoft (NASDAQ: MSFT) covering technical chart insights, latest news, support/resistance, and actionable trade scenarios for Week 51, December 2025. Includes technical and fundamental perspectives.
Welcome to the in-depth weekly analysis for Microsoft (NASDAQ: MSFT) for Week 51, December 2025. In this post, we’ll break down the latest price action, technical signals, news, and actionable trade scenarios for the upcoming week. This comprehensive review is designed for traders and investors seeking a clear, data-driven perspective on MSFT’s short-term outlook. 📊
🗞️ Latest News & Fundamental Developments (Dec 8–15, 2025)
Annual Shareholders Meeting: Microsoft held its Annual Shareholders Meeting virtually on December 5, 2025, providing updates on strategy and capital allocation. [Investor Relations]
Valuation & Analyst Notes: Morningstar maintains a wide economic moat rating for MSFT, but notes bearish pressure from slowing subscription momentum, especially in the Office suite. [Morningstar]
No Major News Releases: No significant news, analyst upgrades/downgrades, or macro events directly impacted MSFT during the past week. The next earnings release date remains unannounced.
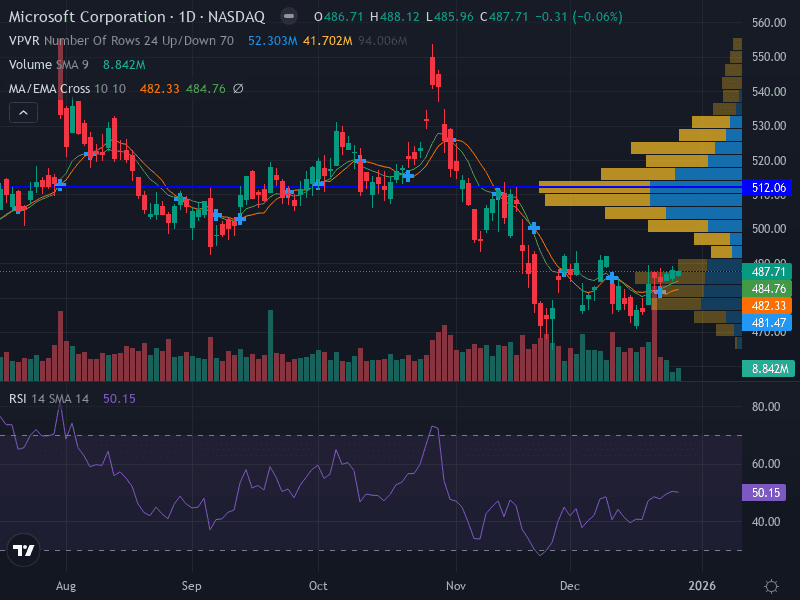
📈 Technical Analysis: Chart Structure & Key Levels
Aspect | Observation |
|---|---|
Trend | Downtrend – Price below 9-day and 21-day EMAs, forming lower highs and lows. |
Pattern | Descending channel with recent rejection at resistance. |
Support Levels | 474.00 (major), 460.00 (minor) |
Resistance Levels | 485.76 (major), 484.21 (minor) |
Momentum (RSI) | 41.49 (bearish, not oversold) |
MACD | Bearish crossover, confirming downward momentum |
Volume | Increasing on declines, decreasing on rallies – sellers in control |
🔍 Chart Interpretation
Bearish Structure: The price remains below key moving averages, confirming the downtrend. Lower highs and lows reinforce the negative bias.
Volume Analysis: Higher volume on down days signals strong selling interest, while lighter volume on rallies suggests weak buyer conviction.
MACD & RSI: Both indicators support the bearish case, with MACD in a negative crossover and RSI below 50 but not yet oversold.
Key Levels to Watch: 474.00 is the primary support; a break could accelerate downside to 460.00. Resistance at 485.76 is critical for any bullish reversal attempt.
💡 Fundamental & News Impact
Microsoft’s fundamentals remain robust, with a wide economic moat and strong capital allocation. However, the lack of major news or catalysts this week means price action is likely to be driven by technicals and broader market sentiment. The recent shareholder meeting did not introduce new strategic shifts, and analyst commentary highlights concerns about slowing growth in mature segments like Office subscriptions. Valuation remains elevated relative to peers, which could limit upside if bearish momentum persists.
🚦 Trade Scenarios & Outlook for Week 51 (Dec 15–21, 2025)
Scenario | Actionable Plan | Key Levels | Probability |
|---|---|---|---|
Bullish 🟢 | Watch for a sustained move above 485.76; consider long positions if price closes above 490.00 (invalidates the bearish setup). | 485.76 (resistance), 490.00 (confirmation) | Low (requires strong reversal and volume) |
Bearish 🔴 | Sell short on rallies to 485.00–486.00, or on breakdown below 474.00. Use stops at 490.00. Target 470.00 and 460.00. | 474.00 (support), 485.76 (resistance), 460.00 (target) | High (trend and momentum favor sellers) |
Neutral 🟡 | Wait for a clear break of 474.00 or 485.76 before taking new positions. Range trading possible between these levels. | 474.00–485.76 (range) | Moderate (if volatility contracts) |
Risk Management Tips
Risk only 0.5–1.5% of capital per trade.
Use ATR (14-day) for dynamic stop placement.
Watch for false breakouts, especially near key levels.
📅 Summary Table: Key Metrics & Levels
Metric | Value |
|---|---|
Current Price | $478.53 |
Fair Value Estimate | $512.00 (Morningstar) |
Support | 474.00 / 460.00 |
Resistance | 485.76 / 490.00 |
RSI | 41.49 |
MACD | Bearish crossover |
Volume Trend | Increasing on declines |
📝 Conclusion
For the week ahead, Microsoft’s technical setup remains bearish, with sellers in control and no major news catalysts to shift sentiment. Traders should monitor the 474.00 and 485.76 levels closely for breakout or reversal signals. Risk management is key, as volatility may increase if these levels are tested. Longer-term investors may consider waiting for clearer signs of reversal or improved fundamentals before adding exposure.
Disclaimer: This analysis is for informational purposes only and does not constitute investment advice. Please consult a financial advisor before making trading decisions.

Julian Vance
Julian Vance is a quantitative strategist focused on algorithmic trading in crypto and futures. His work is dedicated to exploring how traders can leverage technology and data to gain a competitive edge.
Join our newsletter list
Sign up to get the most recent blog articles in your email every week.


More Articles


