Microsoft (MSFT) Weekly Analysis & Outlook – Week 52, December 2025
Ideas
3 Min Read
In-depth weekly analysis of Microsoft (NASDAQ: MSFT) for Week 52, December 2025: chart review, technical and fundamental insights, news impact, and actionable scenarios for traders and investors.
Welcome to the comprehensive weekly analysis for Microsoft (NASDAQ: MSFT) covering Week 52, December 2025. This review combines technical chart insights, the latest news, and actionable trading scenarios to help you navigate the upcoming week with confidence. (Disclaimer: This post is for informational purposes only and does not constitute investment advice. Please conduct your own research or consult a financial advisor before making any trading decisions.)
📰 Latest News & Market Context
Strong Analyst Consensus: Wall Street maintains a Strong Buy rating on MSFT, with 12-month price targets ranging from $625 to $650, implying 30-33% upside (Finviz, 247WallSt).
Robust Financials: Microsoft’s latest quarterly revenue hit $77.67B (+18.4% YoY), with Azure growing 40% and consistent earnings beats (247WallSt).
AI & Cloud Expansion: Major investments in AI/cloud (over $23B committed globally), new Microsoft 365 features, and strategic partnerships continue to drive growth (Microsoft Blog).
📈 Technical Analysis
Aspect | Details |
|---|---|
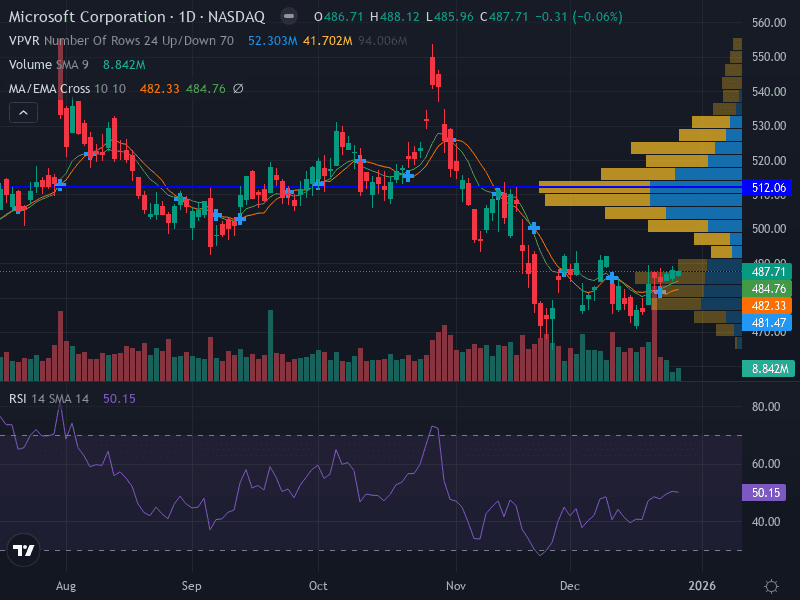
Trend | Sideways – price oscillating around the 10-week EMA, indicating consolidation. |
Support Levels | Major: $482.00 (recent swing low); Minor: $470.00 |
Resistance Levels | Major: $495.00 (recent swing high); Minor: $512.00 |
Momentum | RSI at 48.57 (neutral); MACD below signal line (slightly bearish) |
Volume | Significant spikes near support/resistance, suggesting institutional interest at these pivots |
Pattern | Range-bound consolidation between $482 and $495 |
🔍 Chart Insights
MSFT is consolidating between $482 (support) and $495 (resistance), with volume surges at these levels indicating active positioning by large players.
The MACD remains slightly bearish, but the RSI’s neutral stance suggests the market is awaiting a catalyst for a directional move.
Price is hovering around the 10-week EMA, reinforcing a neutral, range-bound bias for now.
💡 Fundamental & News Impact
Strong Earnings Momentum: Microsoft continues to outperform on revenue and earnings, driven by Azure’s 40% YoY growth and robust enterprise AI adoption.
AI & Cloud Investments: Over $23B in new AI/cloud commitments, including $17.5B in India and $5.42B in Canada, position MSFT at the forefront of global tech infrastructure.
Analyst Optimism: Despite some recent target reductions (e.g., Wolfe Research to $625), the consensus remains overwhelmingly bullish, with 56 out of 57 analysts rating MSFT a Buy or Strong Buy.
Dividend Stability: Quarterly dividend of $0.91 declared, ex-date February 19, 2026, payable March 12, 2026, underlining Microsoft’s commitment to shareholder returns.
Macro Risks: Rising capex for AI infrastructure and broader market volatility could weigh on near-term sentiment, but long-term prospects remain robust.
📊 Scenario Outlook for the Upcoming Week
Scenario | Trigger | Actionable Levels | Probability |
|---|---|---|---|
Bullish 🟢 | Breakout above $495.00 with strong volume | Buy above $495.00 | Moderate (requires confirmation) |
Bearish 🔴 | Breakdown below $482.00 or especially $470.00 | Sell below $470.00 | Low to Moderate (unless macro shock) |
Neutral / Range-bound 🟠 | Price remains between $482.00 and $495.00 | Range trade: Buy near $482.00, Sell near $495.00 | High (current structure favors this) |
Risk Management Tips
Limit risk to 1-2% of trading capital per position.
Use ATR-based stops to accommodate volatility.
Watch for volume confirmation on breakouts/breakdowns.
Monitor macro headlines for unexpected catalysts (e.g., regulatory, AI sector news).
📅 Key Dates & Events
Dividend ex-date: February 19, 2026
Dividend payable: March 12, 2026
Next earnings: January 2026 (exact date TBA)
🔗 Useful Resources
🔑 Summary & Takeaways
Microsoft (MSFT) enters the final week of December 2025 in a consolidation phase, with strong fundamentals and bullish analyst sentiment providing a supportive backdrop. However, the technical picture suggests patience is warranted as the stock trades within a well-defined range. Traders should watch for a decisive move above $495 or below $470 for the next directional cue, while investors can take comfort in Microsoft’s continued growth and innovation leadership.
Disclaimer: This analysis is for informational purposes only and should not be construed as investment advice. Trading stocks involves risk, including the risk of loss. Always conduct your own due diligence.

Julian Vance
Julian Vance is a quantitative strategist focused on algorithmic trading in crypto and futures. His work is dedicated to exploring how traders can leverage technology and data to gain a competitive edge.
Join our newsletter list
Sign up to get the most recent blog articles in your email every week.


More Articles


