Microsoft (MSFT) Weekly Analysis & Outlook – Week 1, December 2025 (Week 1)
Ideas
3 Min Read
Comprehensive weekly analysis of Microsoft (NASDAQ:MSFT) for Week 1, December 2025. Includes technical chart review, latest news, support/resistance, and actionable scenarios for traders and investors.
Welcome to our in-depth, actionable analysis of Microsoft (NASDAQ:MSFT) for Week 1, December 2025 (Week 1). This post provides a comprehensive review of the latest technicals, news, and key scenarios for the week ahead. All analysis is for informational purposes only—please consult your financial advisor before making investment decisions.
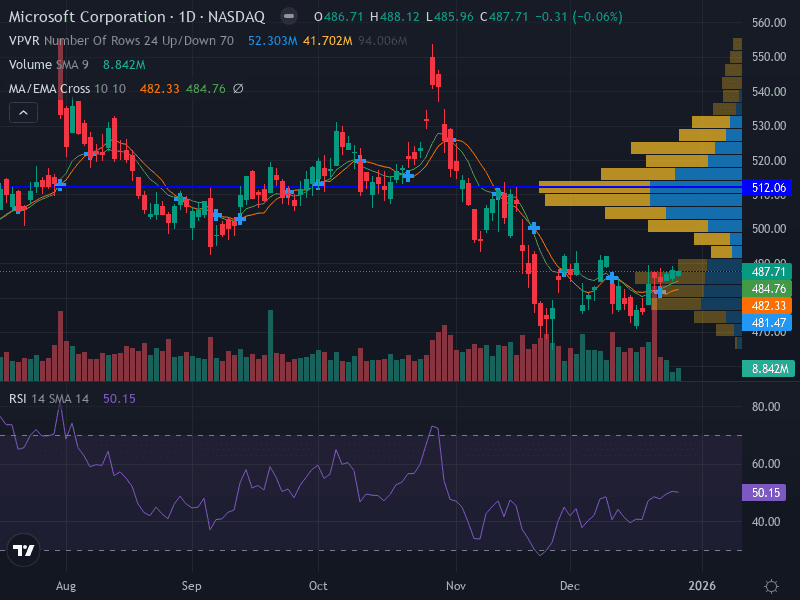
📈 Microsoft (MSFT) – Technical Chart Overview
Chart: Price, Volume, MACD (not shown here – see featured image above)
Current Trend: Neutral – Price is consolidating below major moving averages, with signs of stabilization near support.
Key Support Levels: $482.00 (major, volume profile), $470.00 (minor)
Key Resistance Levels: $492.00 (major, prior swing high), $512.00 (minor, volume profile)
Momentum: RSI at 50.15 (neutral); MACD slightly positive, hinting at possible bullish momentum if confirmed.
Volume: Decreasing on down days, suggesting buyers may be stepping in at support.
Pattern: Consolidation range between $482.00 and $492.00
Support | Resistance | RSI | MACD | Volume |
|---|---|---|---|---|
$482.00 / $470.00 | $492.00 / $512.00 | 50.15 | Slightly positive | Decreasing on down days |
📰 Latest News & Catalysts (Past 7 Days)
AI "Inference Era" Drives Rally: Microsoft anchored the year-end tech rally, with Copilot reaching 150M monthly active users and new launches like Agent 365 and Copilot Studio. [source]
Technical Pullback from Highs: MSFT is down ~9% from its October 2025 high, facing an "AI-driven physics problem" (compute efficiency limits), but technicals show a potential bullish reversal near the 200-day SMA. [source]
AI Capex & Regulatory Focus: Investors are watching Azure margins, inference-to-training ratios, and the potential impact of the GAIN AI Act on chip supply and agent scaling in 2026. [source]
🔬 Technical Analysis: Support, Resistance & Patterns
Price Structure: MSFT is consolidating in a tight range ($482–$492), with a flattening of moving averages and neutral RSI.
MACD: Slightly positive, suggesting early bullish momentum, but confirmation needed with a break above resistance.
Volume: Declining on down days, which may indicate sellers are exhausted and buyers are defending support.
Pattern: Sideways consolidation; potential for a range trade or breakout scenario.
Key Chart Takeaways
Major support at $482.00 is holding, with minor support at $470.00 as a last line of defense.
Resistance at $492.00 is the key level to watch for a bullish breakout; above that, $512.00 becomes the next target.
Invalidation: A weekly close below $470.00 would shift the outlook to bearish.
📊 Fundamental & News Impact
Earnings Recap: Q1 FY2026 beat estimates (revenue $77.7B, EPS $4.13), driven by Azure growth (+40%) and Intelligent Cloud revenue (+28%).
AI Leadership: Copilot adoption (150M MAU, 70%+ Fortune 500) and new AI agent launches position MSFT as a leader in enterprise AI.
Capex & Margins: Heavy AI infrastructure investment (45-50% YoY capex increase) weighs on short-term margins but builds long-term moat.
Regulatory Watch: The GAIN AI Act (2026) could impact chip supply and agent scaling, a key risk for MSFT’s AI roadmap.
Valuation: Consensus price target $634.33; P/E 34.53; dividend yield 0.75%.
🚦 Scenarios & Actionable Outlook for Week 1, December 2025
Scenario | Trigger/Confirmation | Entry | Stop Loss | Target | Probability |
|---|---|---|---|---|---|
Bullish | Break & close above $492.00 | $493.00 | $485.00 | $512.00 | Moderate |
Range/Neutral | Bounce from $482.00–$485.00 | $485.00 | $480.00 | $492.00 | High |
Bearish | Weekly close below $470.00 | Short $468.00 | $475.00 | $455.00 | Low |
Risk Management: Consider risking no more than 1% of capital per trade; use ATR(14-day) for stop size adjustments.
Invalidation: Weekly close below $470.00 would invalidate bullish/range thesis.
🧭 Summary & Key Takeaways
MSFT is consolidating after a strong AI-driven rally, with key support at $482.00 and resistance at $492.00.
News flow remains positive on AI adoption and Copilot growth, but short-term margin pressure and regulatory risks persist.
Most probable scenario: Range trading between $482.00 and $492.00, with a bullish breakout possible if $492.00 is cleared.
Watch for volume surges and news on AI regulation or Azure margins for directional clues.
📅 Prepared for Week 1, December 2025. Stay tuned for next week’s update!
This analysis is for informational purposes only and does not constitute investment advice. Please consult a qualified financial advisor before making trading decisions.

Julian Vance
Julian Vance is a quantitative strategist focused on algorithmic trading in crypto and futures. His work is dedicated to exploring how traders can leverage technology and data to gain a competitive edge.
Join our newsletter list
Sign up to get the most recent blog articles in your email every week.


More Articles


