Meta Platforms (NASDAQ:META) Weekly Technical & News Analysis – Week 52, December 2025
Ideas
3 Min Read
In-depth weekly analysis of Meta Platforms (NASDAQ:META) for Week 52, December 2025: chart review, technical and fundamental insights, and actionable trade scenarios. Stay updated on support/resistance, news, and what to watch next week.
Meta Platforms (NASDAQ:META) – Weekly Analysis & Outlook for Week 52, December 2025
Welcome to our comprehensive weekly analysis of Meta Platforms (META) for Week 52, December 2025. This blog provides a detailed breakdown of the latest price action, technical chart signals, news flow, and actionable scenarios for traders and investors. Let’s dive into the key developments and what they mean for the week ahead. 📊
📰 Latest News & Fundamental Context
Q3 2025 Earnings Recap: Meta’s most recent earnings (October 29) showed $51.24B revenue (up 26% YoY), operating income of $20.54B (margin 40%), but net income dropped to $2.71B due to an unusually high 87% effective tax rate. Diluted EPS was $1.05. [PR Newswire]
Q4 2025 Guidance: Revenue guidance for Q4 is $56-59B, with core growth from Family of Apps (Facebook, Instagram, etc.), but Reality Labs continues to post operating losses. [Meta IR]
Analyst & Investor Sentiment: Recent investor commentary (Dec 16) highlights Meta as a top tech holding due to AI-driven engagement (30%+ YoY video time on Instagram, $50B Reels run rate), disciplined capex (30% cut to metaverse spend), and a strong cash position ($44.5B). Consensus FY25 EPS forecast is steady at 28.89. [24/7 Wall St]
📈 Technical Analysis: Chart Structure & Key Levels
Aspect | Details |
|---|---|
Trend | Sideways/Consolidation |
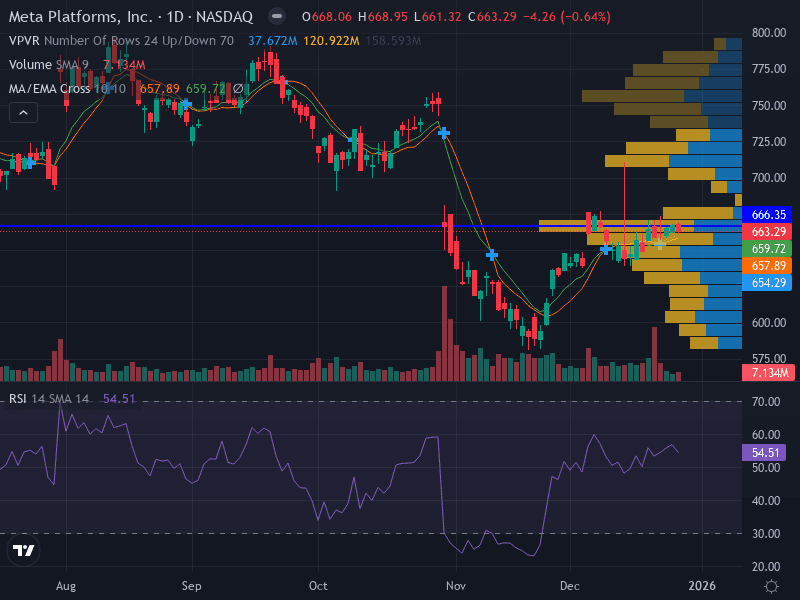
Momentum (RSI) | 53.32 (Neutral) |
MACD | Flat, no clear bullish or bearish crossover |
Volume | Decreasing – potential for breakout or continuation |
Support Levels | 650.41 (major), 645.00 (minor) |
Resistance Levels | 666.35 (major), 675.00 (minor) |
Pattern | Range-bound, flat consolidation |
Interpretation: META’s price action this week is characterized by sideways movement around the 20- and 50-day EMAs. The RSI at 53.32 and flat MACD reinforce the neutral, indecisive tone. Decreasing volume suggests traders are waiting for a catalyst, with a potential breakout looming as the range tightens.
🔎 Fundamental & News Impact
While there have been no major earnings or regulatory headlines in the past week, the Q3 earnings momentum and Q4 guidance continue to underpin sentiment. Investors are focused on:
AI-driven growth: Instagram and Reels engagement remain strong, supporting ad revenue.
Cost discipline: 30% reduction in metaverse spending and robust cash reserves ($44.5B) provide a cushion against macro headwinds.
Tax impact: The prior quarter’s high tax rate was a one-off, with normalized profitability expected in Q4.
📊 Scenario Analysis: What to Watch for This Week
Scenario | Trigger/Signal | Key Price Levels | Potential Action |
|---|---|---|---|
Bullish 🟢 | Break and close above 666.35 (major resistance) | 666.35, 675.00, 685.00 | Buy breakout above 666.50, SL 655.00, Target 685.00 |
Bearish 🔴 | Sustained break below 645.00 (minor support) | 645.00, 640.00 | Sell breakdown below 645.00, SL 652.00, Target 630.00 |
Neutral/Range ⚪ | Price oscillates between 650.00 and 666.00 | 650.00, 666.00 | Range trade: Buy near 650.00, sell near 666.00 |
Trade Setups & Risk Management
Aggressive: Buy breakout above 666.50, stop-loss at 655.00, target 685.00.
Conservative: Wait for a move back to 650.00–652.00 support, buy with stop-loss at 645.00, target 666.00.
Invalidation: Sustained break below 645.00 would shift bias to bearish.
Risk management: Consider risking 1% of capital per trade; use ATR for precise stop-loss placement.
📅 Weekly Outlook & Summary
Meta Platforms enters this week in a neutral consolidation phase. With volume declining and price action tightening, traders should be alert for a breakout from the current range. The fundamental backdrop remains constructive, supported by strong cash flow, disciplined spending, and robust engagement metrics. However, the lack of a clear technical trend means patience and disciplined risk management are key.
Upside risk: A breakout above 666.35 could trigger a rally toward 685.00, especially if volume picks up.
Downside risk: A break below 645.00 would likely see increased selling pressure toward 630.00.
Neutral scenario: Expect continued range-bound trading between 650.00 and 666.00 unless a catalyst emerges.
Disclaimer: This analysis is for informational purposes only and does not constitute investment advice. Trading involves risk. Please conduct your own research or consult a professional before making investment decisions.

Julian Vance
Julian Vance is a quantitative strategist focused on algorithmic trading in crypto and futures. His work is dedicated to exploring how traders can leverage technology and data to gain a competitive edge.
Join our newsletter list
Sign up to get the most recent blog articles in your email every week.


More Articles


