Meta Platforms (NASDAQ:META) Weekly Analysis & Outlook – Week 49, December 2025
Ideas
3 Min Read
In-depth weekly analysis of Meta Platforms (NASDAQ:META) for Week 49, December 2025: technical chart review, latest news, support/resistance, MACD, volume, fundamental impact, and actionable scenarios for traders and investors.
Welcome to our comprehensive weekly analysis of Meta Platforms (NASDAQ:META) for Week 49, December 2025! This post combines technical and fundamental insights to help traders and investors navigate the current market landscape for META. Let’s dive into the latest chart action, news catalysts, and actionable trading scenarios for the week ahead. 📊
📰 Latest News & Short-Term Catalysts
AI Hardware Expansion: Meta is reportedly exploring a major deal to purchase tensor processing units (TPUs) from Alphabet, signaling a strategic move to diversify its AI hardware supply chain and reduce reliance on Nvidia. This could enhance Meta’s AI capabilities and cost efficiency. [Nasdaq]
Q3 2025 Earnings: Meta reported a 26.2% YoY revenue increase to $51.24 billion, beating expectations. However, a one-time $15.93 billion non-cash tax charge impacted reported EPS, raising some concerns about near-term profitability. [Meta IR]
Stock Momentum & Analyst Sentiment: META shares rose 3.5-3.8% in the past week, buoyed by tech sector optimism and positive analyst ratings. Consensus remains a “Moderate Buy” with price targets near $824, reflecting confidence in Meta’s growth and AI initiatives. [MarketBeat]
📈 Technical Analysis
Aspect | Details |
|---|---|
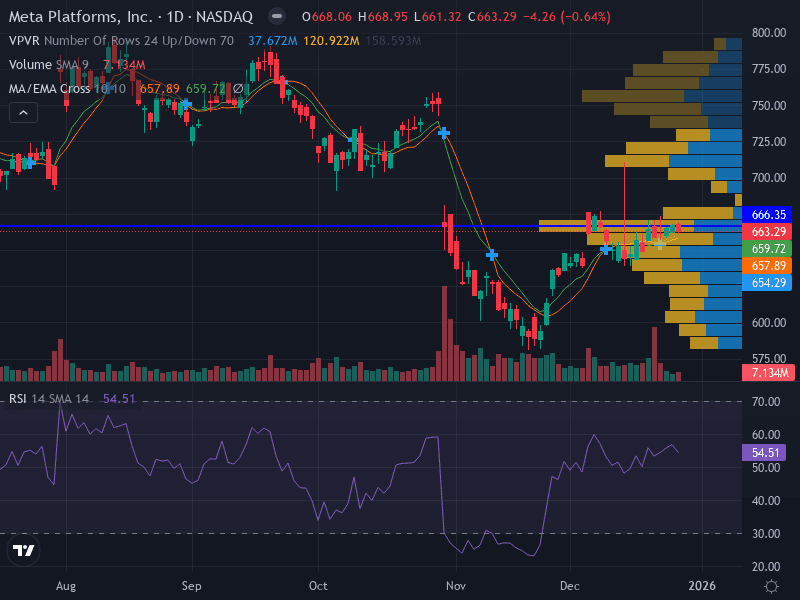
Trend | Uptrend – Price above 10-day EMA, recovering from recent lows. |
Support Levels | Major: 622.74 (prior swing low); Minor: 611.37 |
Resistance Levels | Major: 647.95 (recent high); Minor: 720.10 |
Momentum | RSI at 51.69 (neutral-bullish), indicating upward momentum without overbought risk. |
Volume | Increasing on up days, suggesting strong interest in the recovery move. |
Pattern | Recent recovery from downtrend, support-building evident. |
MACD | Strengthening bullish signals, confirming momentum shift. |
🔍 Chart Insights
Bullish Recovery: META has moved above its 10-day EMA, with price action showing a clear recovery from recent lows.
Support Building: The 622.74 level has acted as a solid support base, with buyers stepping in on dips.
Volume Confirmation: Rising volume on up days supports the bullish case, indicating institutional participation.
MACD & RSI: Both indicators point to strengthening momentum but not yet overbought, allowing room for further upside.
💡 Fundamental & News Impact
Meta’s Q3 2025 results highlight robust revenue growth, driven by advertising and AI initiatives. The one-time tax charge has temporarily clouded EPS figures, but underlying business momentum remains strong. The strategic move to diversify AI hardware with Alphabet’s TPUs could reduce costs and improve AI efficiency, a key differentiator in the competitive tech landscape.
Analyst sentiment remains constructive, with most rating META as a “Moderate Buy” and price targets well above current levels. The market is rewarding Meta’s focus on AI and operational efficiency, despite short-term margin pressure from Reality Labs and tax charges.
📊 Actionable Scenarios for the Upcoming Week
Scenario | Action | Key Levels | Rationale |
|---|---|---|---|
🐂 Bullish | Buy breakout above 648.00 | Entry: 648.00 | Continuation of recovery with strong momentum and volume confirmation. |
🐻 Bearish | Sell if close below 611.37 | Entry: 611.00 | Breakdown of key support would signal trend reversal and increased downside risk. |
⚖️ Neutral | Wait for consolidation between 622.74 and 647.95 | Range: 622.74–647.95 | Sideways action likely as market digests recent gains and news flow. |
🛡️ Risk Management
Risk no more than 1% of capital per trade.
Consider ATR-based stops for dynamic risk adjustment.
Monitor news flow for updates on AI hardware deals and regulatory developments.
📅 Timeframe Alignment
The daily uptrend is confirmed by the recent price recovery and technical signals. Short-term traders should focus on intraday momentum, while swing traders can use the outlined support/resistance levels for entries and exits.
🔗 Useful Resources
Disclaimer: This analysis is for informational purposes only and does not constitute investment advice. Please conduct your own research or consult a professional before making trading decisions.

Julian Vance
Julian Vance is a quantitative strategist focused on algorithmic trading in crypto and futures. His work is dedicated to exploring how traders can leverage technology and data to gain a competitive edge.
Join our newsletter list
Sign up to get the most recent blog articles in your email every week.


More Articles


