Ethereum (ETH/USD) Weekly Analysis & Outlook – Week 52, December 2025
Ideas
3 Min Read
In-depth Ethereum (ETH/USD) analysis for Week 52, December 2025: price chart, technical levels, news impact, and actionable trading scenarios. Discover support/resistance, MACD, volume, and key catalysts for ETH/USD.
Ethereum (ETH/USD) Weekly Analysis & Outlook – Week 52, December 2025
Welcome to this week’s comprehensive analysis of Ethereum (ETH/USD) for Week 52, December 2025. In this post, we’ll break down the latest price action, technical patterns, news catalysts, and actionable scenarios for traders and investors. Let’s dive in! 🚀
📈 Price Chart Overview
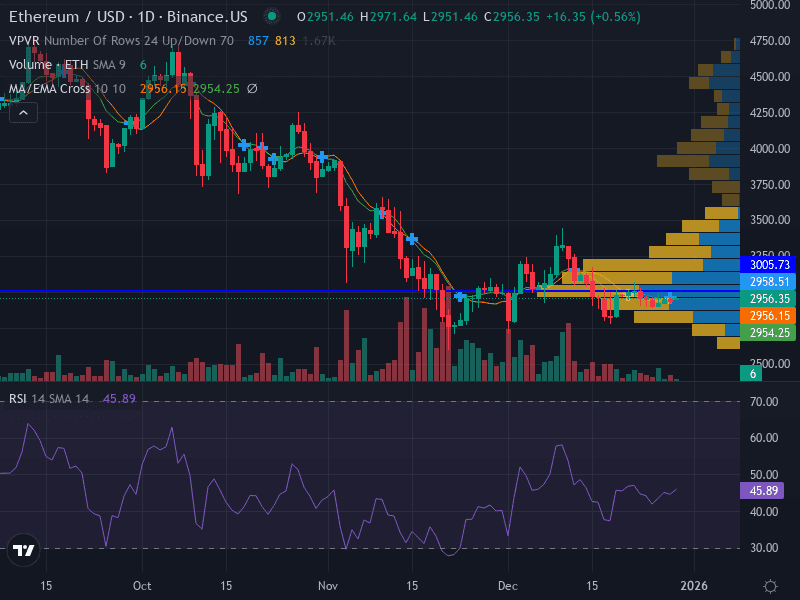
Trend: Bearish – ETH is trading below key moving averages, with a declining trend line from October.
Momentum: RSI near 48.4 (neutral-bearish), reflecting weak momentum and indecision.
MACD: Bearish crossover persists, with no clear sign of reversal.
Volume: Decreasing on rallies, suggesting weak buying interest.
Pattern: Descending channel, with lower highs and lower lows.
📰 Latest News & Catalysts (Past 7 Days)
Bearish short-term trend: ETH trades below $3,000, with sellers in control and market sentiment in “Extreme Fear” (Fear & Greed Index at 20).
[forex24.pro]Bulls defend $3,000: Inverse head-and-shoulders pattern tests market conviction, but upside is capped unless $3,025 is reclaimed.
[Brave New Coin]Upcoming technical upgrade: Ethereum’s gas limit is set to increase from 60M to 80M units after the January 7 hard fork, potentially impacting transaction throughput and fees.
[Brave New Coin]
🔎 Technical Analysis
Key Level | Support | Resistance |
|---|---|---|
Immediate | $2,976.44 (major), $2,981.97 (minor) | $3,029.03 (minor), $3,053.12 (major) |
Weekly | $2,405 – $2,500 | $3,500 – $4,045 |
2025 Pivots | $2,500 | $4,000 – $10,000 |
Support: $2,976.44 (major), $2,981.97 (minor). A break below $2,976 could open the way to $2,900 and $2,500.
Resistance: $3,029.03 (minor), $3,053.12 (major). Bulls need a close above $3,053 to shift momentum.
Pattern: Descending channel. Lower highs and lower lows signal continuation of the downtrend.
MACD: Bearish crossover persists, with histogram below zero. No bullish divergence detected.
Volume: Declining on rallies, indicating weak conviction among buyers. Watch for a volume spike to signal a potential reversal.
RSI: 48.4 – Neutral to bearish. Not oversold, so further downside is possible before a technical bounce.
📊 Fundamental & News Impact
Macro sentiment: Extreme fear dominates the crypto market, with ETH closely tracking Bitcoin’s consolidation.
Technical upgrade: The upcoming gas limit increase (January 7) could improve network throughput, but its short-term price impact is uncertain.
ETF & DeFi tailwinds: Institutional interest and DeFi growth remain long-term bullish factors, but have yet to offset near-term selling pressure.
No major regulatory news: The past week was quiet on the regulatory front for Ethereum.
🧭 Actionable Scenarios for the Week
Scenario | Trigger/Signal | Potential Move | Risk Management |
|---|---|---|---|
Bullish 🟢 | Close above $3,053.12 (major resistance) | Upside toward $3,110, then $3,500 | Use stop-loss below $3,000; risk 0.5–1% capital |
Bearish 🔴 | Break below $2,976.44 (major support) | Downside to $2,900, then $2,500 | Use stop-loss above $3,030; risk 0.5–1% capital |
Neutral/Range 🟡 | Consolidation between $2,976 and $3,053 | Range trading ($2,976–$3,053); fade extremes | Smaller position sizes, quick profit-taking |
Aggressive trade idea: Sell near $3,029 (test of resistance), stop-loss at $3,055, target $2,975.
Conservative trade idea: Wait for a break below $2,976, sell at $2,975, stop-loss at $3,000, target $2,900.
Invalidation: Weekly close above $3,053.12 would shift bias to neutral/bullish.
📅 Weekly Outlook Summary
ETH/USD remains in a short-term downtrend, with risk skewed to the downside unless $3,053 is reclaimed.
Watch for a decisive move outside the $2,976–$3,053 range for directional clarity.
Upcoming network upgrade (January 7) could be a catalyst, but technicals dominate for now.
Risk management is crucial: limit exposure and use stops, as volatility may increase.
Disclaimer: This analysis is for informational purposes only and does not constitute investment advice. Please conduct your own research and consult a financial advisor before making trading decisions.

Julian Vance
Julian Vance is a quantitative strategist focused on algorithmic trading in crypto and futures. His work is dedicated to exploring how traders can leverage technology and data to gain a competitive edge.
Join our newsletter list
Sign up to get the most recent blog articles in your email every week.


More Articles


