Apple (AAPL) Weekly Analysis & Outlook – Week 2 December 2025
Ideas
3 Min Read
Comprehensive weekly analysis of Apple Inc. (AAPL) for Week 2 December 2025. Includes technical chart review, latest news, support/resistance levels, and actionable scenarios for traders and investors.
Welcome to our in-depth weekly analysis of Apple Inc. (NASDAQ: AAPL) for Week 2 of December 2025. This post delivers a comprehensive review of Apple’s recent price action, technical signals, and the latest news flow to help traders and investors navigate the upcoming week. 📈🍏
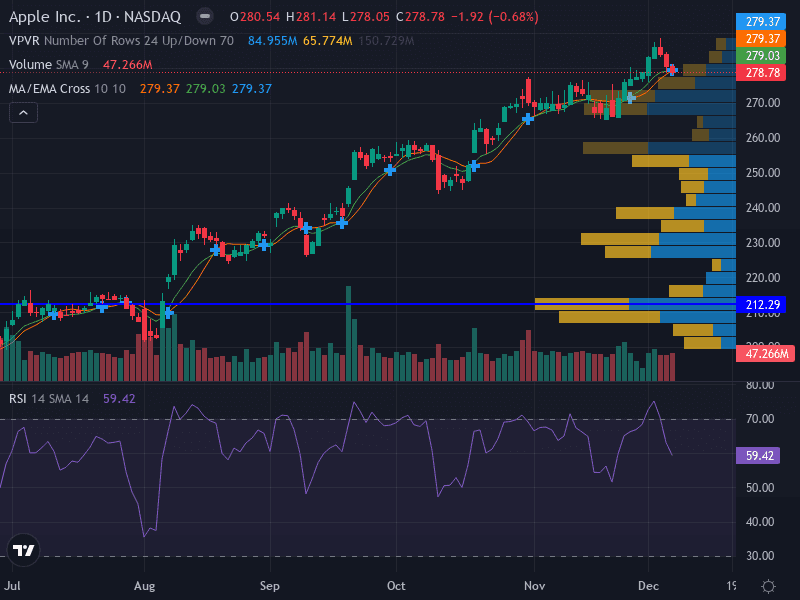
📊 Chart Overview & Technical Summary
The latest daily chart for AAPL reveals a bullish structure as the price remains above the 10-day EMA, forming higher highs. The uptrend is supported by a healthy RSI of 59.42, indicating positive momentum. Volume analysis shows decreasing activity on pullbacks, suggesting strong buying interest. The chart also highlights a recent breakout from a minor consolidation pattern, reinforcing the bullish bias for the short term.
Key Technical Levels | Price ($) |
|---|---|
Major Support | 270.00 |
Minor Support | 260.00 |
Minor Resistance | 279.50 |
Major Resistance | 285.00 |
Trend: Uptrend (price above 10-day EMA)
Momentum: Bullish (RSI 59.42)
Pattern: Continuation with breakout from consolidation
Volume: Decreasing on pullbacks (bullish)
📰 Latest News & Catalysts (Past 7 Days)
Stock Price Fluctuations: AAPL traded between $278.78 and $286.19 over the last week, with the most recent close at $278.78 (Dec 5, 2025). [Source]
ETF Holdings: Apple remains a significant holding in major ETFs, such as 8.1% in iShares Large Cap Growth Active ETF and 6.66% in Direxion Daily AAPL Bull 2X Shares, reflecting continued institutional interest. [Source]
Macro/Analyst Commentary: No new earnings or analyst notes were released in the past week. No major macro events directly affected AAPL during this period.
🔎 Technical Analysis
Support & Resistance: The $270.00 level acts as major support, while $285.00 is the key resistance to watch. Minor levels at $260.00 (support) and $279.50 (resistance) may influence short-term trading decisions.
Pattern & Structure: The continuation pattern and breakout above recent consolidation suggest further upside is possible if momentum persists. The uptrend is intact as long as the price remains above $270.00.
MACD & Volume: While the MACD is not explicitly detailed, the bullish momentum and volume profile (decreasing on pullbacks) support the case for trend continuation. Watch for any divergence or sharp volume spikes as early signals of reversal or acceleration.
💡 Fundamental & News Impact
Apple’s price action this week has been relatively stable, with no major earnings or macro news. The company’s continued prominence in institutional portfolios and ETFs underscores its perceived resilience and growth prospects. Investors should monitor for upcoming product announcements, regulatory developments, or broader tech sector moves that could influence sentiment.
🚦 Possible Scenarios for the Week Ahead
Scenario | Key Levels | Actionable Plan |
|---|---|---|
Bullish 📈 | Above 279.50, Target 285.00 | Look for breakout trades above 279.50 with stops below 274.50. Momentum continuation is likely if volume increases on the breakout. |
Bearish 📉 | Below 270.00, Watch 260.00 | If price closes below 270.00, expect a test of 260.00. Consider short positions or protective puts if downside momentum accelerates. |
Neutral 🤝 | Between 270.00 and 279.50 | Range-bound trading likely. Consider mean-reversion strategies or wait for a decisive breakout above resistance or below support. |
📅 Trade Ideas for the Week
Aggressive: Buy on breakout above 280.00, stop loss at 274.50, target 285.00.
Conservative: Buy on pullback to 270.00, stop loss at 265.00, target 279.50.
Invalidation: Daily close below 260.00 shifts bias to neutral/bearish.
📌 Risk Management & Final Thoughts
Maintain disciplined risk management, especially with stops at key support/resistance levels. Monitor for unexpected news or sector-wide moves that could impact volatility. Apple remains a leader in the tech space, but prudent position sizing and scenario planning are essential for navigating the week ahead.
Disclaimer: This analysis is for informational purposes only and does not constitute investment advice. Please consult your financial advisor before making any trading decisions.

Julian Vance
Julian Vance is a quantitative strategist focused on algorithmic trading in crypto and futures. His work is dedicated to exploring how traders can leverage technology and data to gain a competitive edge.
Join our newsletter list
Sign up to get the most recent blog articles in your email every week.


More Articles


