Apple (AAPL) Weekly Technical & News Analysis – Week 1 January 2026
Ideas
3 Min Read
Comprehensive weekly analysis of Apple Inc. (AAPL) for Week 1 January 2026: technical chart, news summary, key levels, trade setups, and actionable scenarios. Stay informed with the latest insights for AAPL stock.
Welcome to our in-depth weekly analysis of Apple Inc. (NASDAQ: AAPL) for Week 1 of January 2026! In this post, we’ll break down the latest technical chart, summarize recent news, interpret fundamental and technical signals, and provide clear, actionable scenarios for traders and investors. Let’s dive in! 🍏📈
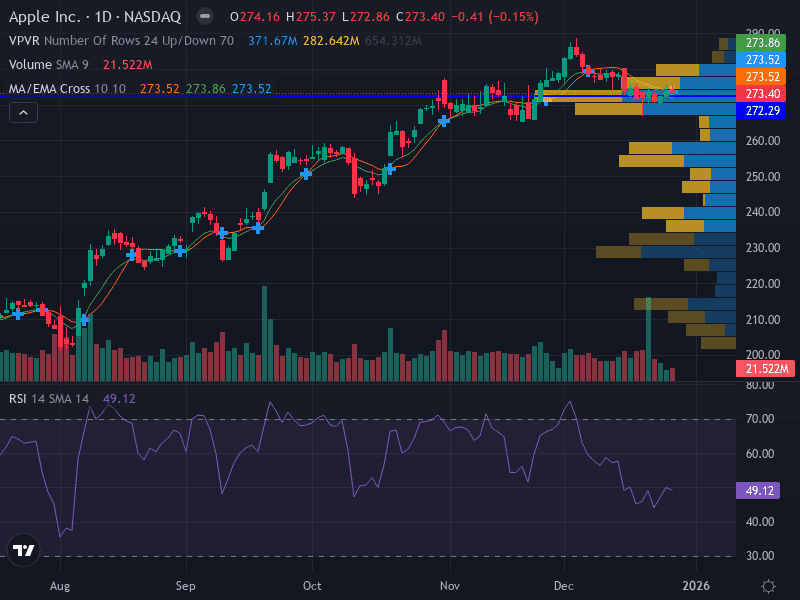
📊 Apple (AAPL) Chart Overview
Technical analysis as of December 29, 2025
Trend: Sideways/Neutral – Price is consolidating around key moving averages with low momentum.
Key Support: $272.29 (major), $260.00 (minor)
Key Resistance: $275.37 (major), $280.00 (minor)
Pattern: Horizontal range between $272.29 and $275.37
Momentum: RSI at 49.12 (neutral), MACD flat
Volume: Decreasing during recent moves, indicating low conviction
Indicator | Current Value | Interpretation |
|---|---|---|
Support | $272.29 / $260.00 | Major and minor levels to watch for downside protection |
Resistance | $275.37 / $280.00 | Potential breakout points |
RSI | 49.12 | Neutral momentum |
MACD | Flat | Lack of strong momentum |
Volume | Decreasing | Low conviction in recent price moves |
📰 Latest News & Short-Term Catalysts (Past 7 Days)
Stock Performance: AAPL closed at $270.97 on December 22, 2025, down 0.99% for the day; another session saw a 1.04% decline to $270.83, underperforming broader indices. [Zacks]
Technical Forecast: Despite recent declines, technical outlook remains neutral with potential for stronger moves if volume picks up. [StockInvest]
Upcoming Earnings: Next earnings expected with EPS of $2.65 (up 10.42% YoY) and revenue of $137.51B (up 10.62% YoY), but no new analyst upgrades or downgrades in the past week. [Zacks]
🔎 Technical Analysis
Apple’s price action this week is characterized by a sideways consolidation between $272.29 and $275.37. The stock is hovering around its 10-week moving average, with both the MACD and RSI indicating a lack of strong momentum. Volume has been declining, suggesting that neither bulls nor bears are currently in control. This sets up a classic range-bound scenario, where breakout or breakdown trades could be triggered by a surge in volume or a significant news event.
Support Levels: $272.29 (major), $260.00 (minor) – Watch for buying interest if price approaches these levels.
Resistance Levels: $275.37 (major), $280.00 (minor) – A break above could signal bullish momentum.
Pattern: Horizontal range, ideal for range-trading strategies until a breakout occurs.
MACD: Flat, confirming the lack of momentum and the potential for a volatility spike if direction is established.
Volume: Decreasing, so watch for a volume spike as a signal for the next directional move.
📈 Fundamental & News Impact
Apple’s fundamentals remain robust, with expectations for double-digit YoY growth in both EPS and revenue in the upcoming earnings report. However, the stock’s forward P/E of 33.73 and PEG ratio of 2.56 are both above industry averages, suggesting a premium valuation. No major analyst upgrades, downgrades, or regulatory news have emerged in the past week, and macroeconomic catalysts have been limited. This lack of fresh news has contributed to the current low-volatility, range-bound environment.
Metric | Value | Industry Avg. | Interpretation |
|---|---|---|---|
Forward P/E | 33.73 | 11.74 | Premium valuation |
PEG Ratio | 2.56 | 1.67 | Above average, growth priced in |
EPS (Est.) | $2.65 | - | +10.42% YoY expected |
Revenue (Est.) | $137.51B | - | +10.62% YoY expected |
🚦 Actionable Scenarios for the Upcoming Week
Scenario | Trigger | Action | Risk Management |
|---|---|---|---|
Bullish | Break above $275.37 with volume | Buy at $275.50, Target $280.00, Stop $272.00 | Risk 1% of capital per trade; adjust size using ATR |
Bearish | Break below $272.29 with volume | Sell/Short at $272.00, Target $260.00, Stop $275.00 | Risk 1% of capital per trade; adjust size using ATR |
Neutral | Price remains between $272.29 and $275.37 | Range trade: Buy near support, sell near resistance | Use tight stops; avoid overtrading in low-volatility |
🧭 Key Takeaways
Apple is consolidating in a tight range, with technicals and fundamentals both supporting a wait-and-see approach until a breakout or breakdown occurs.
Upcoming earnings could be a catalyst for a directional move, but in the absence of news, expect continued range trading.
Risk management is crucial; use stops and position sizing to protect capital in this low-momentum environment.
Disclaimer: This analysis is for informational purposes only and does not constitute investment advice. Please conduct your own research or consult a financial advisor before making trading decisions.

Julian Vance
Julian Vance is a quantitative strategist focused on algorithmic trading in crypto and futures. His work is dedicated to exploring how traders can leverage technology and data to gain a competitive edge.
Join our newsletter list
Sign up to get the most recent blog articles in your email every week.


More Articles


