Amazon (AMZN) Weekly Stock Analysis & Outlook – Week 51, December 2025
Ideas
3 Min Read
Comprehensive weekly analysis of Amazon (NASDAQ:AMZN) for Week 51, December 2025. Includes technical chart review, news impact, support/resistance, and actionable trading scenarios.
Welcome to our in-depth analysis of Amazon (NASDAQ:AMZN) for the week of December 15, 2025 (Week 51). This blog provides a comprehensive review of AMZN’s technical setup, latest news, and actionable scenarios for traders and investors. Let’s dive in! 🚀
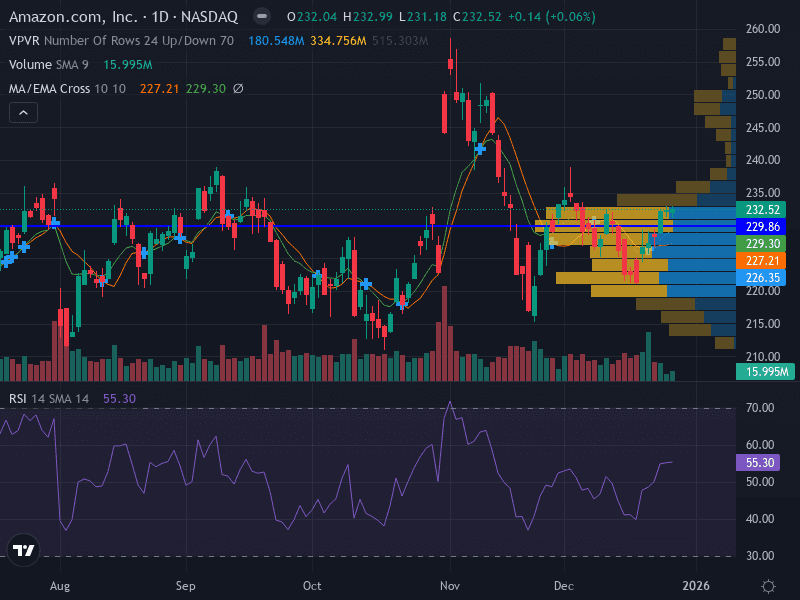
📈 Technical Chart Overview
Trend: Sideways – AMZN is consolidating between its 10-week and 50-week moving averages, reflecting a period of indecision.
Momentum: Neutral – RSI at 44.83 (slightly bearish, not oversold); MACD hovering near the zero line.
Pattern: Symmetrical triangle possibly forming, indicating a potential breakout or breakdown ahead.
Volume: Decreasing during the recent sideways move, suggesting waning conviction among traders.
Key Level | Type | Price |
|---|---|---|
Support | Major | $226.19 |
Support | Minor | $221.93 |
Resistance | Major | $230.45 |
Resistance | Minor | $240.00 |
📰 Latest News & Short-Term Catalysts
Stock Performance: AMZN closed at $226.19 on Friday, December 12, 2025, down 1.78% from $230.28. The stock has increased in 7 of the last 10 days, up 2.85% over the past two weeks, but recent days show mild bearish sentiment and medium volatility. [Source]
Upcoming Earnings: Amazon’s next earnings report is scheduled after market close on Thursday, July 31, 2025. Consensus EPS is expected at $1.31, with AWS and advertising segments under close watch. [Source]
Bond Sale & Expansion: Amazon plans to raise $15 billion via its first U.S. dollar bond sale in three years, likely to fund AI/cloud expansion and infrastructure. [Source]
🔍 Technical Analysis
Support & Resistance
Major Support: $226.19 – Recent consolidation low; a break below could trigger further downside to $221.93.
Major Resistance: $230.45 – Recent swing high; a breakout above could open the path to $240.00.
Pattern Recognition
Symmetrical Triangle: The chart structure hints at a symmetrical triangle, often a precursor to a volatility expansion. Watch for a decisive move outside $226–$230.50 for directional clues.
MACD & Volume Interpretation
MACD: Flat and near the zero line, confirming the absence of a strong trend.
Volume: Declining, indicating reduced trading interest and a possible prelude to a breakout event.
📊 Fundamental & News Impact
Q3 Results: Amazon beat Q3 estimates with EPS of $1.95 and revenue of $180.17B, propelling the stock to an all-time high. However, recent AWS results have raised questions about growth sustainability.
Q2 Anticipation: Investors are focused on AWS and advertising segment growth, with AI and cloud infrastructure expansion as key themes. The $15B bond sale underscores Amazon’s commitment to these areas.
Macro Backdrop: No major macroeconomic headwinds reported in the past week; consumer demand remains resilient, and Amazon’s leadership in cloud and AI is intact.
📅 Possible Scenarios for the Upcoming Week
Scenario | Trigger | Action | Target | Stop Loss |
|---|---|---|---|---|
Bullish | Break above $230.50 | Buy strength | $240.00 | $226.00 |
Bearish | Failure near $230.00 | Short | $226.20 | $232.50 |
Neutral | Continued range-bound action | Wait for breakout | N/A | N/A |
Risk Management: Consider risking 1% of capital per trade and use ATR-based stops to adjust for volatility.
Timeframe Alignment: Daily and weekly charts confirm the sideways movement; intraday traders may find opportunities within the $226–$230.50 range.
📝 Summary & Outlook
Amazon (AMZN) enters Week 51 of December 2025 in a consolidation phase, with technicals and fundamentals suggesting a wait-and-see approach. The symmetrical triangle pattern, declining volume, and neutral momentum indicate a potential breakout is brewing. Key drivers for the week will be any updates on AWS, bond sale progress, and anticipation of the upcoming earnings report. Traders should watch the $226–$230.50 range closely for actionable signals. 📅
Disclaimer: This analysis is for informational purposes only and does not constitute investment advice. Please conduct your own research or consult a financial advisor before making trading decisions.

Julian Vance
Julian Vance is a quantitative strategist focused on algorithmic trading in crypto and futures. His work is dedicated to exploring how traders can leverage technology and data to gain a competitive edge.
Join our newsletter list
Sign up to get the most recent blog articles in your email every week.


More Articles


