Amazon (AMZN) Stock Analysis & Outlook – Week 52, December 2025
Ideas
3 Min Read
In-depth weekly analysis of Amazon (NASDAQ:AMZN) for Week 52, December 2025: technical chart, news, support/resistance, MACD, volume, and actionable scenarios. Stay informed with the latest trends and catalysts.
Amazon (NASDAQ:AMZN) – Weekly Stock Analysis & Outlook for Week 52, December 2025
Welcome to our comprehensive analysis of Amazon’s stock (AMZN) for the week of December 22, 2025 (Week 52). This blog post provides a deep dive into technicals, fundamentals, and actionable trading scenarios for the upcoming week. All data and analysis are current as of December 22, 2025.
📰 Latest News & Catalysts (Past 7 Days)
AI-Driven Growth & Capex Surge: Amazon is trading near $221.27 after reaching an all-time high of $258.60 in November 2025. Recent volatility is attributed to heavy capital expenditures on AI hardware, including $92 billion annually for data centers and custom chips, which reduced Q3 2025 free cash flow to $14.8 billion from $47 billion prior. [Source]
OpenAI Partnership & Analyst Upgrades: Amazon is in discussions for a $10B+ investment in OpenAI to expand AI workloads on AWS. Bank of America reiterated a Buy rating with a $303 target, citing AWS AI strength and ecosystem reinforcement. [Source]
Strong Fundamentals Amid Market Lag: Despite only a 2% YTD gain, Amazon’s TTM net income is up 53% YoY to $76.48B, with 2025 revenue estimates at $694–710B. Institutional holders remain committed, and consensus analyst ratings are Strong Buy with 30% upside targets. [Source]
📊 Technical Analysis
Aspect | Details |
|---|---|
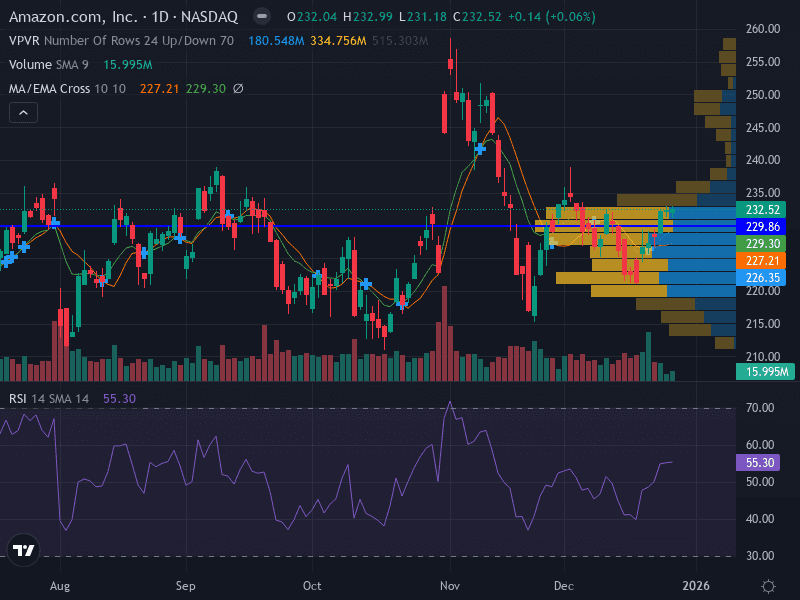
Trend | Sideways/Neutral – Price consolidating between 10- and 20-day EMAs |
Pattern | Range-bound, potential descending triangle forming |
Support Levels | Major: 226.35 | Minor: 222.00 |
Resistance Levels | Major: 229.86 | Minor: 235.00 |
Momentum | RSI 48.49 (neutral) |
Volume | Decreasing on declines, suggesting weakening selling pressure |
MACD | Flat, no clear bullish or bearish momentum |
🔎 Chart Insights
Price is consolidating between key moving averages, with no clear directional bias.
Volume is tapering off on down days, indicating sellers are losing conviction.
Potential descending triangle pattern could resolve with a breakout or breakdown.
MACD is flat, supporting the neutral momentum view.
🧮 Fundamental & News Impact
AI Capex: Amazon’s aggressive AI investments are compressing near-term free cash flow but are expected to drive long-term AWS and AI leadership.
Analyst Sentiment: Over 45 analysts rate AMZN a Strong Buy, with average 12-month price targets of $284.70–$296.85 (30% upside from current levels).
Institutional Support: Major holders like Vanguard and BlackRock remain committed, viewing Amazon as a balanced retail/AI play.
Macro Risks: Cloud competition and high Capex are near-term risks, but e-commerce stability and AI growth are long-term positives.
📈 Actionable Scenarios for Week 52 (December 22–28, 2025)
Scenario | Trigger/Signal | Action | Key Levels |
|---|---|---|---|
Bullish 🟢 | Breakout above 229.86 resistance | Buy at 230.00, Stop Loss (SL) 226.00, Target 235.00 | Entry: 230.00 |
Bearish 🔴 | Breakdown below 222.00 support | Sell/Short below 222.00, SL 224.00, Target 216.00 | Entry: 221.90 |
Neutral 🟡 | Continued range-bound action between 222.00–229.86 | Wait for a decisive breakout or breakdown before entering new positions | Range: 222.00–229.86 |
Risk Management Tips
Risk only 0.5–1% of capital per trade.
Use ATR(14) for dynamic stop-loss placement.
Monitor volume and MACD for early signs of a breakout or breakdown.
📅 Weekly Outlook Summary
Amazon’s stock is consolidating after a volatile year, with technicals showing a neutral bias and fundamentals highlighting long-term AI-driven growth. Traders should watch for a break above 229.86 or below 222.00 for directional cues. Near-term risks are balanced by strong institutional support and robust analyst sentiment.
Disclaimer: This analysis is for informational purposes only and does not constitute investment advice. Please consult a financial advisor before making trading decisions.

Julian Vance
Julian Vance is a quantitative strategist focused on algorithmic trading in crypto and futures. His work is dedicated to exploring how traders can leverage technology and data to gain a competitive edge.
Join our newsletter list
Sign up to get the most recent blog articles in your email every week.


More Articles


