Amazon (AMZN) Weekly Technical & News Analysis – Week 50, December 2025
Ideas
3 Min Read
In-depth weekly analysis of Amazon (NASDAQ:AMZN) for Week 50, December 2025. Includes technical chart review, key news, support/resistance, and actionable trade scenarios.
Amazon (NASDAQ:AMZN) – Weekly Analysis & Outlook for December 8–14, 2025 (Week 50)
Welcome to this week’s comprehensive analysis of Amazon’s stock performance and outlook. In this post, we’ll dive into the latest technical chart, summarize the most impactful news and analyst notes, and provide actionable scenarios for traders and investors. Keywords: Amazon stock, AMZN analysis, AWS, technical analysis, support resistance, trading ideas, December 2025, stock outlook.
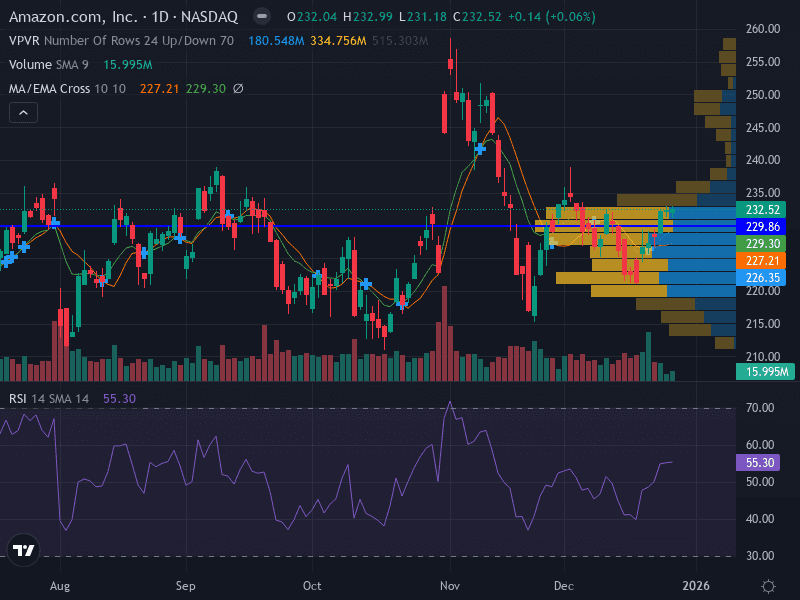
📊 Chart Overview & Technical Summary
Current Trend: Neutral – Price is consolidating between key moving averages, indicating indecision.
Support Levels: $227.53 (major), $221.93 (minor)
Resistance Levels: $230.67 (major), $229.83 (minor)
Momentum: RSI at 48.19 (neutral), hovering around the midpoint
Pattern: Range-bound with recent swing highs and lows
Volume: Slight increase on recent down moves, suggesting selling pressure
MACD: Indicates consolidation; no clear bullish or bearish momentum
Indicator | Current Value | Interpretation |
|---|---|---|
Price | $229.53 (Dec 5, 2025 close) | Near resistance, within recent range |
RSI | 48.19 | Neutral, no overbought/oversold signal |
MACD | Flat | Consolidation, no strong trend |
Volume | Increasing on down moves | Suggests mild selling pressure |
📰 Latest News & Catalysts (Past 7 Days)
AWS Growth & Analyst Outlook: Analysts remain bullish on AWS, expecting it to drive significant upside for Amazon. AWS is projected to double capacity by 2027, though recent growth has slowed compared to competitors. [Barchart]
Q3 2025 Earnings: Amazon reported $147.2B in sales and $6B in operating income. International markets and Prime Video advertising are growth areas. [Amazon IR]
Stock Performance & Analyst Targets: Shares have consolidated in 2025, up 13% over six months. Average analyst target is $296 (27% upside), with the highest at $360. Oppenheimer raised its target to $305 on AWS prospects. [Morningstar]
🔍 Technical Analysis
Support & Resistance:
Major Support: $227.53 – A break below could trigger a move toward $221.93.
Major Resistance: $230.67 – A breakout above may open the path to $236.00.
Pattern: Range-bound. Price is fluctuating between $221.93 and $230.67, with no clear trend. Watch for a breakout to signal the next directional move.
MACD & Volume: The MACD is flat, confirming the consolidation. Volume has picked up on down moves, suggesting mild selling pressure but not a decisive bearish trend.
Momentum: RSI at 48.19 is neutral, indicating neither overbought nor oversold conditions.
📈 Fundamental & News Impact
AWS Remains the Engine: Cloud growth is central to Amazon’s valuation. While AWS growth has slowed relative to Azure and Google Cloud, it remains highly profitable and a key long-term driver.
International Expansion: Growth in Brazil, India, and Japan, plus investments in logistics and automation, are expected to boost margins and speed delivery.
Valuation & Sentiment: Amazon trades at a forward P/E of 32.4, with analysts forecasting ~30% earnings growth for FY2025. Analyst sentiment is positive, but investors remain cautious due to macro risks and regulatory uncertainties.
Recent Price Action: Shares closed at $229.53 on Dec 5, 2025, up 0.18% for the day, within a 52-week range of $161–$258.
🛠️ Actionable Scenarios for the Upcoming Week
Scenario | Trigger | Action | Target | Stop Loss |
|---|---|---|---|---|
Bullish | Break above $230.67 | Buy at $231.00 | $236.00 | $227.50 |
Bearish | Rejection at $229.83 | Short at $229.83 | $224.00 | $231.50 |
Neutral | Price remains between $227.53 and $230.67 | Wait for breakout | N/A | N/A |
Risk Management: Limit risk to 1% of capital per trade. Consider using ATR-based stops to account for volatility.
Invalidation: A sustained move below $221.93 could lead to further downside and invalidate bullish setups.
📅 Weekly Outlook Summary
Amazon’s stock is consolidating near resistance, with a neutral technical bias for the week. The fundamental backdrop remains positive, driven by AWS and international expansion, but near-term price action may be range-bound unless a breakout occurs. Traders should watch for a move above $230.67 or below $227.53 to signal the next directional trade. Analyst sentiment is constructive, but macro and competitive risks warrant caution.
Disclaimer: This analysis is for informational purposes only and does not constitute investment advice. Please conduct your own research or consult a financial advisor before making trading decisions.

Julian Vance
Julian Vance is a quantitative strategist focused on algorithmic trading in crypto and futures. His work is dedicated to exploring how traders can leverage technology and data to gain a competitive edge.
Join our newsletter list
Sign up to get the most recent blog articles in your email every week.


More Articles


