Amazon (AMZN) Weekly Analysis & Outlook – Week 49, December 2025
Ideas
3 Min Read
Comprehensive weekly analysis of Amazon (NASDAQ:AMZN) for Week 49, December 2025. Includes technical chart review, key news, support/resistance, and actionable trading scenarios.
Amazon (NASDAQ:AMZN) enters Week 49 of 2025 with a neutral technical setup, consolidating between key support and resistance levels amid mixed market sentiment and evolving macroeconomic factors. This in-depth analysis covers the latest chart signals, news, and actionable scenarios for traders and investors. 📈
📰 Latest News & Catalysts (Past 7 Days)
Stock Recovery & Analyst Sentiment: Amazon shares climbed 7% last week but remain below their November highs. Analyst consensus remains bullish, with a Strong Buy rating and an average price target near $280 (+20% upside). However, some caution persists regarding AI profitability and AWS growth. (TipRanks)
Q3 2025 Earnings: Amazon beat estimates with EPS of $1.95 (vs. $1.57 expected) and revenue up 13% YoY to $180.2B. Despite strong results, stock gains faded due to concerns over AI-related profitability and broader tech sector pressure. (Amazon IR)
Macro & Retail Trends: Black Friday online sales hit $11.8B (+9.1% YoY), with Amazon typically seeing a 3% sales boost post-event, signaling robust consumer demand. Broader market sentiment is affected by Fed policy uncertainty and sector rotation. (TradingView)
📊 Technical Analysis
Aspect | Details |
|---|---|
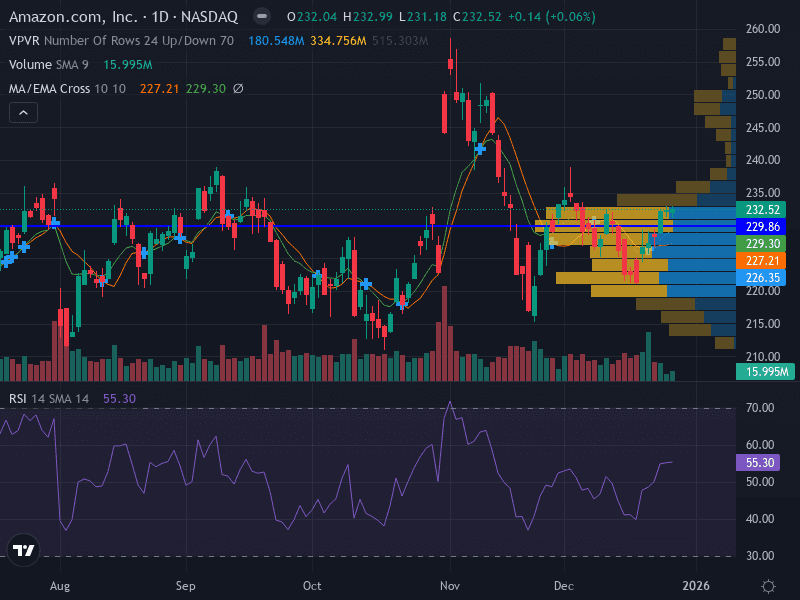
Trend | Sideways/Neutral – Price oscillating between 9-day and 20-day EMA, lacking clear direction. |
Support Levels | Major: 226.90 (high volume node); Minor: 223.34 |
Resistance Levels | Major: 233.22 (recent swing high); Minor: 229.58 |
Pattern | Consolidation between 226.90 and 233.22 – potential for range breakout. |
Momentum | RSI at 52.32 (neutral); MACD not provided in chart, but price action shows indecision. |
Volume | Decreasing on recent upswing, suggesting weakening buying pressure. |
🔍 Chart Structure & Interpretation
Range-Bound Action: AMZN is consolidating between $226.90 and $233.22, with no decisive breakout yet. This range reflects indecision as traders await new catalysts.
Volume Analysis: Lower volume on recent rallies hints at buyer fatigue. Watch for a volume spike to confirm any breakout attempt.
Momentum: RSI near 52 signals a lack of strong directional bias. A move above 60 or below 40 would indicate a shift in momentum.
💡 Fundamental & News Impact
AI & Cloud Growth: AWS remains a key driver, with analysts projecting acceleration in 2026 due to AI demand. However, some warn of potential dilution of returns from heavy AI capital spending.
Retail Strength: Strong Black Friday sales and robust Q3 earnings support Amazon’s retail segment, but margin pressures and macro uncertainty linger.
Analyst Consensus: Despite mixed short-term sentiment, the majority of analysts maintain a bullish long-term outlook with price targets well above current levels.
📈 Actionable Scenarios for the Week
Scenario | Trigger/Signal | Action | Price Levels | Risk Management |
|---|---|---|---|---|
Bullish | Breakout above $233.22 on strong volume | Buy on breakout confirmation | Entry: $233.50+ | Risk 1% of capital; use ATR(14) for stop sizing |
Bearish | Breakdown below $223.34 | Sell/Short on breakdown | Entry: $223.00 | Risk 1% of capital; adjust stops for volatility |
Neutral/Range | Continued consolidation between $226.90–$233.22 | Range trade: Buy near support, sell near resistance | Buy: $227.00 | Reduce size; quick profit-taking |
🛡️ Risk Management & Strategy Notes
Limit risk to 1% of capital per trade.
Use ATR(14) to dynamically size stops based on volatility.
Monitor volume and price action for breakout/breakdown confirmation.
Stay alert to macro news (Fed, sector rotation) and upcoming Amazon events.
🔚 Summary & Outlook
Amazon (AMZN) is in a holding pattern as it digests recent earnings, analyst revisions, and macro shifts. The technical picture suggests a likely continuation of range-bound trade unless a decisive breakout occurs. Traders should watch for volume-confirmed moves above $233.22 or below $223.34 for directional cues. Long-term fundamentals remain robust, but near-term caution is warranted given sector volatility and evolving AI/cloud narratives.
Disclaimer: This analysis is for informational purposes only and does not constitute investment advice. Please consult a licensed financial advisor before making trading decisions.

Julian Vance
Julian Vance is a quantitative strategist focused on algorithmic trading in crypto and futures. His work is dedicated to exploring how traders can leverage technology and data to gain a competitive edge.
Join our newsletter list
Sign up to get the most recent blog articles in your email every week.


More Articles


