Alphabet (GOOGL) Weekly Analysis & Outlook – Week 1, December 2025 (Week 1)
Ideas
3 Min Read
In-depth weekly analysis of Alphabet (GOOGL) for Week 1, December 2025: chart review, latest news, technical and fundamental outlook, and actionable trading scenarios.
Welcome to your comprehensive weekly analysis of Alphabet Inc. (NASDAQ: GOOGL) for Week 1, December 2025 (Week 1). This post delivers a deep dive into the latest technical chart action, news catalysts, fundamental context, and actionable scenarios for the week ahead. Whether you’re a trader, investor, or market observer, this analysis is designed to equip you with the insights needed to navigate GOOGL’s near-term price action. (Disclaimer: This content is for informational purposes only and not financial advice. Please consult a professional before making investment decisions.)
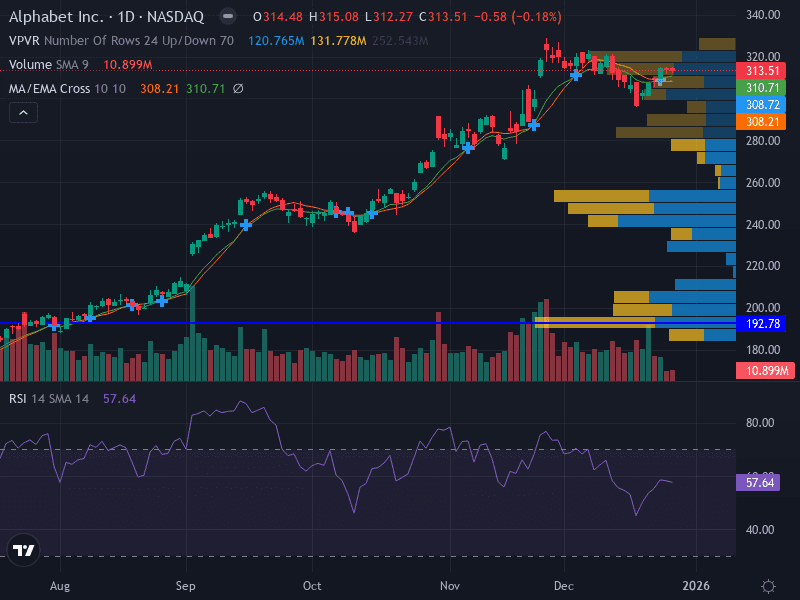
📈 Chart Overview & Technical Structure
Trend: GOOGL remains in a strong uptrend, trading above its 10-day EMA and consolidating near recent highs. The daily chart shows a series of higher highs and higher lows since August 2025.
Key Support Levels:
Major: $308.21 (10-day EMA)
Minor: $292.00
Key Resistance Levels:
Major: $320.00 (recent high)
Minor: $315.00
Momentum: The RSI is at 57.64, indicating bullish momentum without being overbought. The MACD (trend inferred from chart analysis) is trending higher, supporting the bullish bias.
Volume: Volume has decreased during the current consolidation, but was notably higher during previous rallies—suggesting healthy accumulation rather than distribution.
Pattern: Price is consolidating near highs after a strong uptrend, a classic setup for a potential continuation breakout.
Technical Indicator | Current Reading | Implication |
|---|---|---|
Trend | Uptrend | Bullish bias |
10-day EMA | $308.21 | Key support |
RSI | 57.64 | Positive, not overbought |
MACD | Trending higher | Momentum supports bulls |
Volume | Decreasing on consolidation | Healthy, not distribution |
📰 Latest News & Catalysts (Past 7 Days)
Institutional Buying: HBK Sorce Advisory LLC increased its stake in GOOGL by 47.1% in Q3, as reported December 28, 2025. This signals growing institutional confidence.
Corporate Action: Alphabet announced the acquisition of Intersect to advance U.S. energy innovation (Investor Relations, December 22, 2025), reinforcing its commitment to diversification and sustainability.
Analyst & Market Sentiment: Recent commentary highlights that Alphabet has "de-risked" after regulatory clarity and is being rewarded for AI advances (notably Gemini). Analysts maintain strong Buy ratings with an average target near $315.90 (MarketMinute).
🔬 Technical Analysis: Support, Resistance, and Patterns
Support & Resistance:
Major Support: $308.21 (10-day EMA). A close below this level could trigger a deeper pullback toward $292.00.
Major Resistance: $320.00 (recent high). A breakout above this level would likely accelerate bullish momentum, with $325.00 as the next target.
Minor Levels: Watch $315.00 (minor resistance) and $309.50 (minor support) for intraday pivots.
Pattern Recognition: GOOGL is consolidating just below major resistance after a sustained uptrend. This is typically a bullish continuation pattern, provided support holds and volume picks up on a breakout.
MACD & Volume: The MACD is trending higher, confirming bullish momentum. Volume has tapered during consolidation, which is constructive as long as it expands on any breakout attempt.
💡 Fundamental & News Impact
AI Leadership: Alphabet’s advances in AI, especially with Gemini, are driving analyst upgrades and investor optimism. The company’s ability to monetize AI is seen as a key growth lever for 2026 and beyond.
Regulatory Clarity: After a year of regulatory uncertainty, recent rulings have reduced headline risk, allowing the stock to re-rate higher.
Institutional Flows: The notable increase in institutional holdings (e.g., HBK Sorce Advisory LLC) is a positive signal for near-term sentiment.
Macroeconomic Factors: Year-end portfolio rebalancing and tax-related flows can increase volatility. Central bank policy and global ad demand remain key macro drivers for GOOGL’s valuation.
Recent Acquisition: The Intersect deal highlights Alphabet’s ongoing diversification and strategic investments in energy innovation.
📊 Actionable Scenarios for the Upcoming Week
Scenario | Trigger/Level | Potential Move | Risk Management |
|---|---|---|---|
Bullish | Breakout above $320.00 | Target $325.00+ | Stop-loss below $315.00 or trailing ATR |
Neutral | Range-bound between $308.00–$320.00 | Scalp intraday moves; wait for breakout | Use tight stops; reduce position size |
Bearish | Close below $308.00 (10-day EMA) | Target $292.00 | Stop-loss above $310.00 |
Aggressive Long: Buy on breakout above $315.50, stop-loss at $308.00, target $325.00.
Conservative Long: Wait for a retracement to $308.50–$309.50, stop-loss at $305.00, target $320.00.
Invalidation: A close below $292.00 would shift the outlook to bearish/neutral for the short term.
📅 What to Watch This Week
Any new SEC filings or insider transactions
Further analyst upgrades or changes in price targets
Macro headlines affecting tech/ad demand (Fed policy, global growth)
Updates on the Intersect acquisition and AI product rollouts
📝 Summary Table
Factor | Current Status | Outlook |
|---|---|---|
Trend | Uptrend, consolidating near highs | Bullish bias |
Support | $308.21 (major), $292.00 (minor) | Watch for breakdown risk |
Resistance | $320.00 (major), $315.00 (minor) | Breakout could accelerate gains |
Volume | Decreasing on consolidation | Needs to expand on breakout |
MACD | Trending higher | Supports bullish scenario |
News | Institutional buying, acquisition, AI upgrades | Positive sentiment |
Macro | Year-end flows, central bank policy | Potential for volatility |
🔔 Final Thoughts
Alphabet (GOOGL) enters the first week of December 2025 with a bullish technical setup, strong institutional support, and positive analyst sentiment driven by AI and regulatory clarity. However, traders should remain vigilant for volatility due to year-end flows and macro headlines. Monitor key levels and news catalysts closely to adjust your positioning as the week unfolds.
Disclaimer: This analysis is for informational purposes only and does not constitute investment advice. Trading involves risk. Always do your own research or consult a financial advisor before making decisions.

Julian Vance
Julian Vance is a quantitative strategist focused on algorithmic trading in crypto and futures. His work is dedicated to exploring how traders can leverage technology and data to gain a competitive edge.
Join our newsletter list
Sign up to get the most recent blog articles in your email every week.


More Articles


