Alphabet (GOOGL) Weekly Analysis & Outlook – Week 51, December 2025
Ideas
3 Min Read
Comprehensive weekly analysis of Alphabet (GOOGL) for December 15–21, 2025: chart, technicals, news, and actionable scenarios. Neutral trend, key levels, and AI-driven catalysts.
Alphabet (GOOGL) Weekly Analysis: December 15–21, 2025 (Week 51)
Welcome to this week’s in-depth analysis of Alphabet Inc. (NASDAQ:GOOGL). As we enter Week 51 of 2025, GOOGL finds itself consolidating near key technical levels, with market participants closely watching for the next directional move. This blog post covers the latest chart insights, news, technical and fundamental analysis, and actionable scenarios for the week ahead. 📊
📈 GOOGL Price Chart Overview
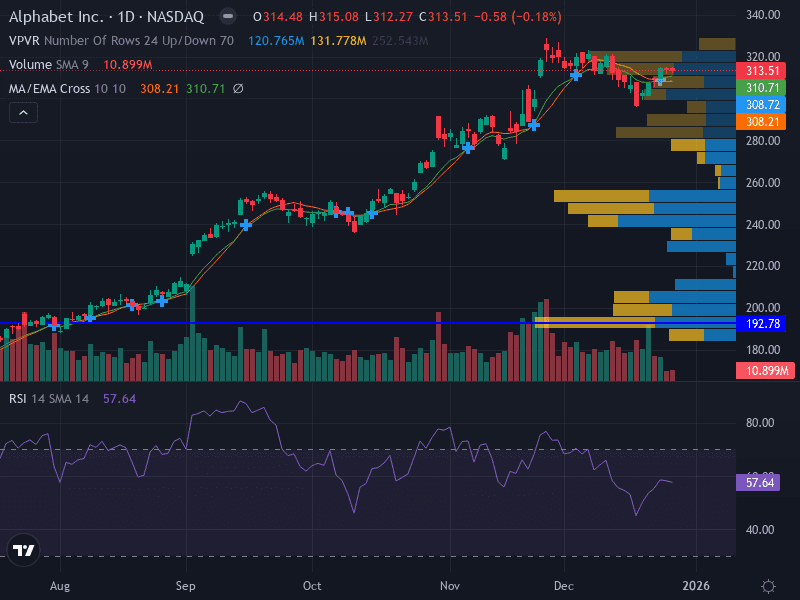
See the chart at the top for a visual summary of this week’s technical landscape.
Current Price: $308.79 (as of December 14, 2025)
52-Week Range: $140.53 – $328.83
Market Cap: $3.73T
P/E Ratio: 30.51
Dividend Yield: 0.27%
Volume (last session): 35.94M (near average)
📰 Latest News & Short-Term Catalysts
Date | Headline | Summary | Source |
|---|---|---|---|
2025-12-14 | Alphabet Stock Performance | GOOGL closed at $308.79, showing resilience amid intraday volatility and consolidating near key levels. | |
2025-12-14 | Alphabet vs. Microsoft: AI Leadership | Alphabet’s market cap surged to nearly $3.9T, outpacing Microsoft. Strong AI investments (Google Gemini, Cloud, Waymo) and robust free cash flow support continued innovation. | |
2025-12-08–14 | No Major Earnings or Analyst Upgrades | No significant earnings, analyst notes, or macro catalysts reported this week. Focus remains on AI and market positioning. | N/A |
🔍 Technical Analysis
Trend: Sideways/Neutral – GOOGL is consolidating between major support and resistance, with no clear breakout yet.
Support Levels:
Major: $305.56
Minor: $280.00
Resistance Levels:
Major: $316.19
Minor: $313.87
Pattern: Price is ranging between $305.56 and $316.19, suggesting a consolidation phase.
Momentum: RSI at 55.60 (neutral, slight bullish tilt); MACD is flat, indicating indecision.
Volume: Decreasing on recent moves, which may signal exhaustion and a potential for a breakout or reversal.
Indicator | Current Reading | Interpretation |
|---|---|---|
RSI | 55.60 | Neutral, slight bullish tilt |
MACD | Flat | Indecision, no clear momentum |
Volume | Decreasing | Potential exhaustion, watch for breakout |
📊 Fundamental & News Impact
AI Leadership: Alphabet is investing heavily in AI (Google Gemini, Cloud, Waymo), supporting long-term growth and market leadership.
Financial Strength: $74B free cash flow (TTM) and a robust balance sheet enable aggressive capital expenditures ($91–93B projected for AI).
Valuation: Trades at a P/E of 30.51, close to the S&P 500 average, after a ~70% YTD gain. Relative valuation remains attractive given growth prospects.
Market Sentiment: No major earnings or analyst upgrades this week; focus remains on AI innovation and competitive positioning.
🔮 Possible Scenarios for the Week Ahead
Scenario | Trigger/Signal | Actionable Plan | Key Levels |
|---|---|---|---|
Bullish 🟢 | Breakout above $316.19 | Consider long positions on confirmed breakout; target $325.00. Stop-loss: $311.00 | $316.19 (breakout), $325.00 (target) |
Bearish 🔴 | Weekly close below $305.56, especially $300.00 | Consider short positions if breakdown confirmed. Target $280.00. Stop-loss: $307.00 | $305.56 (support), $300.00 (invalidates bull), $280.00 (target) |
Neutral 🟡 | Continued range-bound action between $305.56–$316.19 | Range trading strategies: buy near support, sell near resistance. Tight stops recommended due to potential breakout risk. | $305.56 (support), $316.19 (resistance) |
Risk Management: Risk 0.5–1% of capital per trade; consider using ATR for dynamic stop-loss placement.
Timeframe Alignment: Daily chart supports a neutral bias, with potential for short-term bullish momentum if a breakout occurs.
Confidence Level: Medium – Price is constrained within a well-defined range, awaiting a catalyst for direction.
📅 Summary & Outlook
Alphabet (GOOGL) enters Week 51, 2025, in a consolidation phase, trading between $305.56 and $316.19. With no major earnings or analyst events, attention remains on AI innovation and market leadership. Traders should watch for a breakout above $316.19 for bullish confirmation or a breakdown below $305.56 for a bearish turn. Neutral strategies may benefit from range trading until a clear direction emerges. As always, prudent risk management is essential in this environment of potential volatility.
Disclaimer: This analysis is for informational purposes only and does not constitute investment advice. Please conduct your own research or consult a financial advisor before making trading decisions.

Julian Vance
Julian Vance is a quantitative strategist focused on algorithmic trading in crypto and futures. His work is dedicated to exploring how traders can leverage technology and data to gain a competitive edge.
Join our newsletter list
Sign up to get the most recent blog articles in your email every week.


More Articles


