Tesla (TSLA) Weekly Analysis & Outlook – Week 10, March 2026
Ideas
3 Min Read
In-depth weekly analysis of Tesla (NASDAQ: TSLA) for Week 10, March 2026: price chart, technical levels, news impact, and actionable trading scenarios. Read the latest on TSLA's trends, support/resistance, and catalysts.
Welcome to our comprehensive weekly analysis of Tesla, Inc. (NASDAQ: TSLA) for Week 10, March 2026. This post delivers a deep dive into TSLA's technical landscape, recent news, and actionable scenarios for traders and investors. All insights are based on the latest price action, volume, and macro/fundamental drivers as of March 2, 2026. Always consult your own financial advisor before making trading decisions.
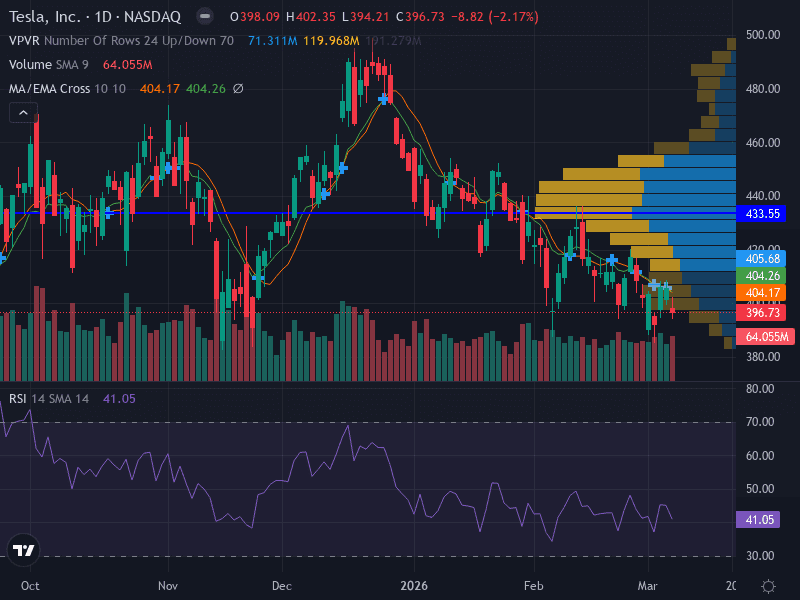
📊 TSLA Price Chart Overview
Trend: Bearish — Price is below the 10-day EMA, forming lower lows since December 2025.
Current Price: $401.80 (as of March 1, 2026)
Support Levels: $398.11 (major), $380.00 (minor)
Resistance Levels: $411.52 (major), $433.55 (minor)
Volume: 56.89M (above average)
MACD: Declining, supporting bearish momentum
RSI: 41.24 (bearish)
📰 Latest News & Catalysts (Past 7 Days)
Date | Event | Source |
|---|---|---|
2026-03-01 | Tesla to deliver critical Full Self-Driving (FSD) crash data to NHTSA, impacting regulatory outlook. | |
2026-02-27 | Technical analysis highlights: Close above $416.52 could target $442.86–$502.72; failure risks $321.89 in Q2–Q3. | |
2026-02-25 | Investor sentiment: TSLA -8.1% monthly return vs. S&P 500 -1%; Zacks Rank #4 (Sell). |
🔍 Technical Analysis
Trend & Structure: TSLA remains in a downtrend with price action below the 10-day EMA and a series of lower highs and lows. The chart reveals a potential descending triangle pattern, signaling further downside risk.
Support: $398.11 is the immediate major support. If breached, $380.00 becomes the next key level.
Resistance: $411.52 is the first major resistance, with $433.55 above as a secondary barrier. A close above $433.55 would invalidate the bearish thesis.
Volume: Volume has increased on down days, confirming bearish momentum. Rallies are accompanied by lighter volume, indicating weak buying interest.
MACD: The MACD line is declining, supporting the bearish trend. No bullish crossover is evident.
RSI: At 41.24, the RSI is below neutral, suggesting bearish momentum but not yet oversold.
Pattern: The descending triangle, with lower highs and horizontal support, often precedes breakdowns in weak markets.
Key Technical Levels Table
Level | Type | Significance |
|---|---|---|
$398.11 | Support | Recent swing low; breakdown risk |
$380.00 | Support | Next downside target if $398.11 fails |
$411.52 | Resistance | Major resistance above 10-day EMA |
$433.55 | Resistance | Bearish thesis invalidation |
📈 Fundamental & News Impact
FSD Data Submission: Regulatory scrutiny on Tesla’s Full Self-Driving (FSD) could impact both sentiment and future product launches.
Robotaxi & Optimus: Expansion into robotaxis and unveiling of Optimus v3 as production-ready highlight Tesla’s push beyond autos, but these are longer-term catalysts.
Earnings: Current quarter consensus EPS is $0.39 (+44.4% YoY), but estimates have been revised down 16.9% in the last 30 days. Revenue last quarter missed by 0.94%.
Valuation: TSLA trades at a P/E of 374.29, reflecting high growth expectations but also significant risk if execution falters.
Sentiment: Zacks Rank #4 (Sell) and -8.1% monthly return signal caution among analysts and investors.
🗺️ Scenarios & Actionable Outlook for Week 10 (March 4–8, 2026)
Scenario | Trigger | Action | Target | Stop Loss |
|---|---|---|---|---|
Bullish | Close above $411.52 | Consider long positions | $433.55, then $442.86 | $398.11 |
Bearish | Break below $398.11 | Consider short positions | $380.00, then $370.00 | $411.52 |
Neutral | Range-bound $398.11–$411.52 | Wait for breakout | N/A | N/A |
Aggressive Bearish: Sell at $402.00 (trend continuation), stop loss at $412.00, target $390.00.
Conservative Bearish: Wait for a confirmed break below $398.11 before entering short, stop loss at $410.00, target $380.00.
Bullish Invalidating Scenario: A close above $433.55 would shift the outlook to neutral/bullish, targeting $442.86 and higher.
Risk Management: Risk no more than 1% of capital per trade; use ATR(14) for stop sizing.
📅 Summary Table
Aspect | Details |
|---|---|
Trend | Bearish, below 10-day EMA |
Pattern | Descending triangle |
Support | $398.11, $380.00 |
Resistance | $411.52, $433.55 |
Key Catalyst | FSD data, robotaxi, earnings |
Sentiment | Negative, Zacks Rank #4 (Sell) |
⚠️ Disclaimer
This analysis is for informational purposes only and does not constitute investment advice. Trading stocks involves risk; always do your own research and consult a licensed financial advisor before acting on any information provided.

Julian Vance
Julian Vance is a quantitative strategist focused on algorithmic trading in crypto and futures. His work is dedicated to exploring how traders can leverage technology and data to gain a competitive edge.
Join our newsletter list
Sign up to get the most recent blog articles in your email every week.


More Articles


