Tesla (TSLA) Weekly Outlook & Analysis – Week 11, March 2026
Ideas
3 Min Read
In-depth weekly analysis of Tesla (TSLA) for Week 11, March 2026: technical chart review, latest news, key support/resistance, FSD/NHTSA updates, and actionable trading scenarios.
Weekly Analysis for Tesla (TSLA) – March 9–15, 2026 (Week 11)
Welcome to this week’s comprehensive analysis of Tesla, Inc. (NASDAQ: TSLA). This post covers the latest technical chart insights, news catalysts, and a detailed trading outlook for the week of March 9, 2026. Whether you’re a trader, investor, or Tesla watcher, this report provides actionable intelligence and context for your decisions. 🔍📈
1. Tesla (TSLA) Chart Overview & Technical Analysis
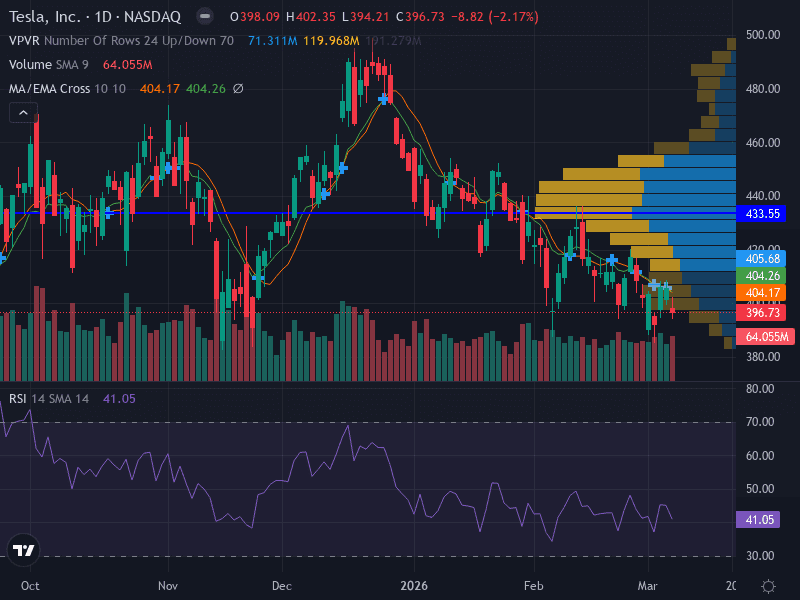
Summary: The current technical setup for TSLA is bearish. The price is below key moving averages, forming lower lows, and is trading within a potential descending triangle pattern. Volume analysis shows increasing sell-side activity, and momentum indicators (like MACD and RSI) suggest further downside risk but with possible oversold conditions approaching.
Indicator | Current Reading | Interpretation |
|---|---|---|
Support | 390 (major), 370 (minor) | Key levels where buyers may step in |
Resistance | 405 (major), 433 (minor) | Likely sell zones; breakout above 405 could reverse trend |
Trend | Downtrend | Price below 10-day EMA, lower highs |
Pattern | Descending Triangle | Bearish continuation risk |
Volume | Rising on down days | Strong selling pressure |
MACD | Negative divergence | Bearish momentum |
RSI | 41 | Bearish, nearing oversold |
Chart Structure: The descending triangle pattern is a classic bearish continuation signal. The flat support at $390 is crucial; a breakdown below this level could accelerate selling. Resistance at $405 is the first hurdle for any bullish reversal attempt. Volume spikes on down days reinforce the bearish bias, while MACD and RSI readings indicate that momentum remains negative but could be approaching a short-term exhaustion point.
2. Latest News & Short-Term Catalysts (March 2–9, 2026)
Analyst Upgrades & Price Targets: Wedbush raised its bull-case price target, envisioning a $2–3 trillion market cap by end-2026, driven by AI, FSD (Full Self-Driving) expansion, and robotics. However, other analysts remain cautious due to core auto delivery declines and margin pressures. [AInvest] [Teslarati]
Product & Software Updates: Tesla rolled out the 2026.2.9 software update to a subset of vehicles, introducing FSD v14-like features and improved Summon visualizations. The update also rebrands some features, reflecting Tesla’s push towards AI-driven autonomy. [TeslaOracle]
Regulatory & Macro Events: The NHTSA set a March 9 deadline for Tesla to submit FSD crash data, covering 58 incidents and nearly 2.9 million vehicles. This probe is critical for regulatory clarity on Robotaxi and FSD deployment. [Invezz]
3. Fundamental & News Impact
Mixed Analyst Sentiment: While some analysts are bullish on Tesla’s AI and autonomy roadmap, others highlight risks from declining auto deliveries, margin pressures, and heavy reliance on energy storage growth. The $450 price target is debated, with execution on AI/robotics and energy storage seen as pivotal.
Product Innovation: The FSD v14-like update and AI branding reinforce Tesla’s leadership in autonomous driving, but regulatory scrutiny (NHTSA probe) and public safety concerns could impact adoption and sentiment in the near term.
Macro & Regulatory Risks: The March 9 NHTSA deadline is a key event. A negative outcome could weigh on the stock, while a positive or neutral resolution may remove an overhang. Additionally, global delivery stabilization and China demand are being closely watched as catalysts for Q2 and beyond.
4. Actionable Scenarios & Trading Plan for Week 11 (March 9–15, 2026)
Scenario | Trigger | Action | Price Levels |
|---|---|---|---|
Bullish 📈 | Breakout above 405 (with volume) | Consider long positions targeting 433; watch for confirmation on strong news or regulatory clarity | Entry: 406–410 |
Bearish 📉 | Breakdown below 390 (with volume) | Consider short positions targeting 370 or lower; monitor for negative NHTSA/regulatory news | Entry: 389–387 |
Neutral ⏸️ | Range-bound between 390–405 | Wait for clear breakout or breakdown; avoid overtrading choppy action | Entry: N/A |
Risk Management Tips:
Risk no more than 1% of capital per trade.
Use stop-loss orders to protect against sharp moves, especially around regulatory headlines.
Monitor volume and news flow for confirmation before entering trades.
5. Key Takeaways & Outlook
TSLA is in a bearish technical setup but could see sharp moves on regulatory or product news.
Watch the $390 support and $405 resistance closely for directional cues.
Regulatory clarity on FSD and Robotaxi, as well as China/energy growth, are the main near-term catalysts.
Stay nimble and adjust positions as new information emerges throughout the week.
Disclaimer: This analysis is for informational purposes only and does not constitute investment advice. Trading involves risk; always do your own research and consult a professional advisor.

Julian Vance
Julian Vance is a quantitative strategist focused on algorithmic trading in crypto and futures. His work is dedicated to exploring how traders can leverage technology and data to gain a competitive edge.
Join our newsletter list
Sign up to get the most recent blog articles in your email every week.


More Articles


