NVIDIA (NVDA) Weekly Analysis & Outlook – Week 2, March 2026
Ideas
3 Min Read
Comprehensive weekly analysis of NVIDIA (NVDA) for Week 2, March 2026: technical chart review, latest news, support/resistance, MACD, volume, fundamental impact, and actionable scenarios for traders.
Welcome to our in-depth analysis of NVIDIA (NASDAQ: NVDA) for the week of March 9, 2026 (Week 2 of March). This blog post provides a comprehensive review of NVDA’s technical setup, the latest news and catalysts, and actionable trading scenarios for the coming week. Whether you’re a trader or investor, this analysis aims to equip you with the insights needed to navigate NVDA’s price action. 📊💡
📰 Latest News & Fundamental Drivers
JPMorgan Raises Price Target: JPMorgan increased its 12-month price target for NVDA to $265 (from $250), maintaining an overweight rating. The move reflects optimism about NVIDIA’s AI-driven revenue growth and robust data center performance. [Source]
AI Industry Momentum: AI models predict NVDA could reach $202 by March 31, 2026, citing strong fundamentals and persistent demand for AI infrastructure. [Source]
Upcoming GTC Event: NVIDIA’s GTC (March 16-19, 2026) will highlight the Blackwell Ultra ramp, new AI chip launches, and strategic partnerships, potentially acting as a catalyst for price movement. [Source]
📈 Technical Analysis
Aspect | Details |
|---|---|
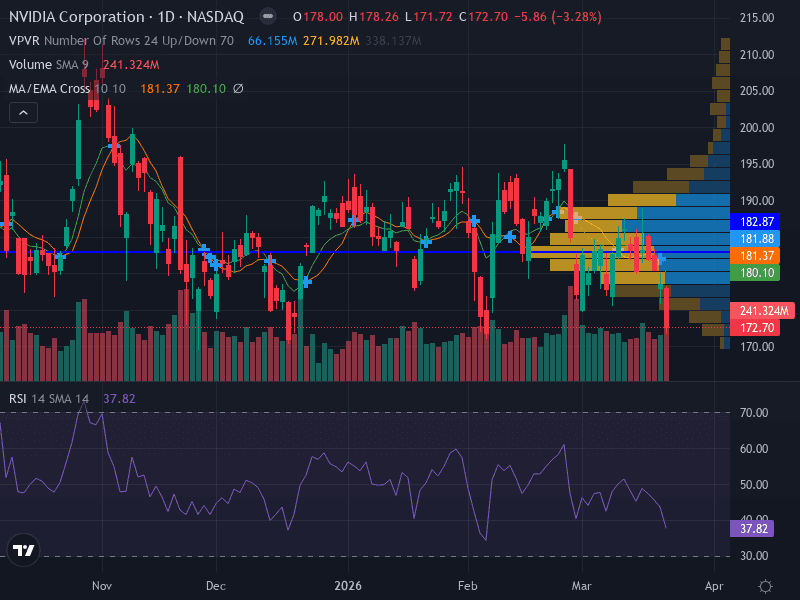
Trend | Bearish – Price below 9-day EMA and 20-day SMA, confirming a downtrend since late 2025. |
Momentum | RSI at 42.42 (bearish zone), indicating weakening momentum. |
Support Levels | Major: $177.82; Minor: $170.00 |
Resistance Levels | Major: $184.88; Minor: $188.20 |
Pattern | Recent swing low at $176.82; structure favors continuation of bearish trend. |
Volume | Increasing on down moves, signaling stronger bearish sentiment. |
MACD | Bearish crossover confirmed; histogram negative, supporting downside bias. |
🔍 Chart Structure & Interpretation
Downtrend Intact: NVDA remains below key moving averages, with lower highs and lower lows on the daily chart.
Volume Analysis: Bearish volume spikes during sell-offs indicate institutional selling pressure.
MACD: The MACD line is below the signal line, with a widening negative histogram, confirming bearish momentum.
💼 Fundamental & News Impact
NVIDIA’s long-term fundamentals remain robust, with record-breaking Q3 FY2026 results ($57B revenue, $51.2B from Data Center). Analyst upgrades and the upcoming GTC event provide potential positive catalysts. However, macro risks (sector compression, export controls, and competition) could limit near-term upside. AI infrastructure demand and new product launches (Blackwell, Rubin) are expected to support medium-term growth.
📊 Actionable Scenarios for the Upcoming Week
Scenario | Trigger | Action | Price Levels |
|---|---|---|---|
Bullish 🟢 | Break and close above $188.20 | Consider long positions targeting $202, with stop-loss below $184.88 | Entry: $188.20+ |
Bearish 🔴 | Break below $177.82 support | Consider short positions targeting $170, with stop-loss above $183.19 | Entry: $177.50 |
Neutral ⚪️ | Range-bound between $177.82 and $184.88 | Wait for breakout; avoid new positions until clear direction emerges | Range: $177.82–$184.88 |
📅 Key Dates & Events
March 16-19, 2026: NVIDIA GTC (potential for major announcements and volatility)
Next Earnings: Q1 FY2027 guidance and results expected in May 2026
⚠️ Risk Management & Trading Tips
Risk 1–2% of capital per trade; use ATR or technical levels for stop-loss sizing.
Monitor volume and price action closely around support/resistance for confirmation.
Stay alert to macro news and sector sentiment shifts, especially around GTC event.
🔑 Summary Table
Aspect | Summary |
|---|---|
Bias | Bearish (short-term), Neutral-to-Bullish (medium-term with catalysts) |
Key Levels | Support: $177.82, $170.00; Resistance: $184.88, $188.20 |
Upcoming Catalysts | GTC event, product launches, analyst upgrades |
Risks | Macro headwinds, sector rotation, regulatory/export controls |
📢 Final Thoughts
NVIDIA’s technicals point to a cautious outlook for this week, with a bearish bias unless key resistance is reclaimed. Traders should watch for volatility around the GTC event and use clear risk management. Medium-term prospects remain attractive due to AI leadership and product innovation, but near-term risks require vigilance.
This analysis is for informational purposes only and does not constitute investment advice. Please conduct your own research or consult a financial advisor before making trading decisions.

Julian Vance
Julian Vance is a quantitative strategist focused on algorithmic trading in crypto and futures. His work is dedicated to exploring how traders can leverage technology and data to gain a competitive edge.
Join our newsletter list
Sign up to get the most recent blog articles in your email every week.


More Articles


