NVIDIA (NVDA) Analysis & Outlook – Week 13, March 2026
Ideas
3 Min Read
In-depth weekly analysis of NVIDIA (NVDA) for Week 13, March 2026. Includes technical chart review, latest news, support/resistance, and actionable trading scenarios for the week ahead.
Weekly Analysis for NVIDIA (NVDA) – Week 13, March 2026
Welcome to this week’s comprehensive analysis of NVIDIA (NASDAQ: NVDA) for Week 13, March 2026. This blog post delivers a detailed technical and fundamental review, integrating the latest chart data, news, and actionable scenarios for traders and investors. 📊
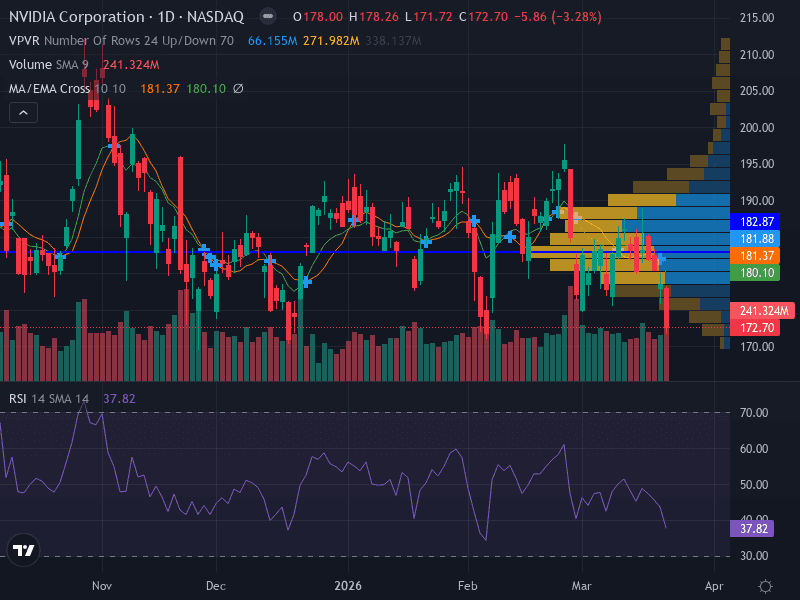
1. Technical Chart Overview 📉
Trend: Bearish – NVDA is trading below both its 10-day and 50-day moving averages, confirming a prevailing downtrend.
Momentum: RSI at 37.82 (bearish, approaching oversold territory); MACD continues to trend lower, reinforcing the negative momentum.
Pattern: A potential descending triangle is forming, with lower highs and price action testing a significant support area.
Volume: Increasing volume on declines, indicating heightened selling pressure and a risk of further breakdown.
Key Level | Price | Significance |
|---|---|---|
Major Support | $171.70 | Recent low, critical for trend continuation |
Minor Support | $165.00 | Next support if breakdown occurs |
Major Resistance | $181.37 | Previous consolidation area, key for reversal |
Minor Resistance | $182.87 | Breakout level; close above could shift bias |
Summary: The technical setup is currently bearish, with a risk of further downside if support levels fail. Watch for a potential breakdown below $171.70 or a reversal above $182.87 for directional cues.
2. Latest News & Short-Term Catalysts 📰
Rosenblatt Securities raised its price target on NVDA to $325 (from $300) on March 18, 2026, citing strong AI infrastructure demand and maintaining a buy rating. [TheStreet]
GTC 2026 Announcements: CEO Jensen Huang highlighted $1 trillion in Blackwell and Vera Rubin orders through 2027, new partnerships (Hyundai, T-Mobile, Adobe, Roche), and US/China approval for H200 sales, despite margin pressures. [StockTitan]
AI & Quantum Expansion: Nvidia is expanding into sovereign AI, robotics, and quantum computing, with new software and hardware launches, and easing supply constraints via HBM4 production. [Bloomberg/YouTube]
Key Takeaways: The news flow remains highly positive for NVDA’s long-term prospects, but near-term price action is dominated by technical weakness and macro headwinds (e.g., US-China trade, margin pressures).
3. Technical Analysis: Support, Resistance, and Patterns 🔍
Support Levels: $171.70 (major), $165.00 (minor). A break below $171.70 could accelerate downside momentum toward $165.00.
Resistance Levels: $181.37 (major), $182.87 (minor). A close above $182.87 would invalidate the bearish thesis and could trigger short covering.
Pattern: Descending triangle suggests sellers are in control, with lower highs and flat support.
MACD: Trending lower, confirming bearish momentum.
Volume: Spikes on down days signal institutional selling and potential for further weakness.
Indicator | Current Reading | Interpretation |
|---|---|---|
RSI | 37.82 | Bearish, nearing oversold |
MACD | Bearish | Negative momentum persists |
Volume | Rising on declines | Distribution phase, sellers active |
4. Fundamental & News Impact 💡
Analyst Upgrades: Rosenblatt’s $325 price target reflects optimism about AI infrastructure, Blackwell/Rubin product lines, and sovereign AI deals.
Partnerships & Roadmap: New deals with Hyundai, T-Mobile, Adobe, Roche, and others expand NVDA’s ecosystem and reinforce its leadership in AI and hardware.
Macro Factors: US-China trade approvals for H200 chips support near-term revenue, but margin pressures and global competition remain risks.
Growth Outlook: Multi-year AI and quantum computing trends underpin long-term growth, but short-term volatility is likely as markets digest macro and technical signals.
5. Actionable Scenarios for the Upcoming Week 🗓️
Scenario | Trigger | Action | Target | Stop Loss |
|---|---|---|---|---|
Bullish | Weekly close above $182.87 | Buy breakout | $190.00+ | $178.00 |
Bearish | Breakdown below $171.70 | Sell/short | $165.00 | $176.00 |
Neutral | Range-bound between $171.70 and $182.87 | Wait for breakout or breakdown | N/A | N/A |
Risk Management: Consider risking only 0.5–1% of capital per trade; use ATR-based stops for flexibility.
Timeframe Alignment: Daily and intraday charts confirm the bearish bias, but monitor for reversal signals at key levels.
6. Conclusion 📝
NVIDIA (NVDA) faces a technically challenging week, with bearish momentum dominating despite strong fundamental news and analyst upgrades. Traders should closely monitor the $171.70 and $182.87 levels for directional cues, and manage risk proactively given the potential for volatility. Long-term investors may view pullbacks as opportunities, but short-term caution is warranted.
Disclaimer: This analysis is for informational purposes only and does not constitute investment advice. Please conduct your own research or consult a financial advisor before making trading decisions.

Julian Vance
Julian Vance is a quantitative strategist focused on algorithmic trading in crypto and futures. His work is dedicated to exploring how traders can leverage technology and data to gain a competitive edge.
Join our newsletter list
Sign up to get the most recent blog articles in your email every week.


More Articles


