Netflix (NASDAQ:NFLX) Weekly Analysis & Outlook – Week 12, March 2026
Ideas
3 Min Read
In-depth analysis of Netflix (NASDAQ:NFLX) for Week 12, March 2026: chart review, key support/resistance, technical and fundamental insights, and actionable scenarios for traders.
Welcome to our comprehensive weekly analysis of Netflix (NASDAQ:NFLX) for Week 12, March 2026! This post provides a deep dive into the latest price action, technical indicators, news, and actionable trading scenarios to help you navigate the week ahead. 📊
1. Price Chart Overview
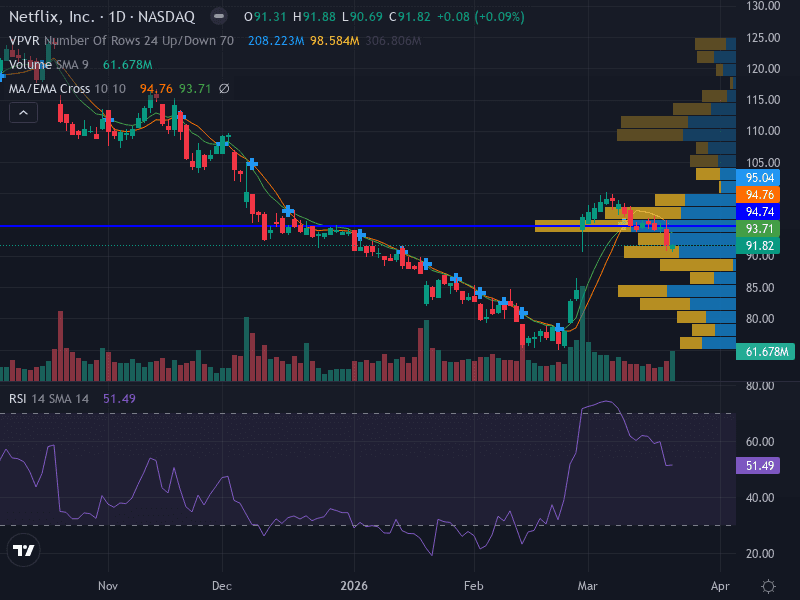
The chart for NFLX this week shows a bullish structure with price action consistently above the 10-day moving average. The RSI is at 62.04, signaling ongoing upward momentum but not yet overbought. Volume has increased on up-moves, suggesting accumulation by market participants. The price is consolidating above the key $94.00 level, with a potential for continuation if this area is broken to the upside.
Indicator | Current Value | Interpretation |
|---|---|---|
10-day EMA | Above Price | Bullish trend |
RSI | 62.04 | Bullish, not overbought |
Volume | Rising on up-moves | Accumulation |
MACD | Positive | Momentum supports uptrend |
2. Latest News & Short-Term Catalysts 📰
Wells Fargo Analyst Note (Mar 9, 2026): Reinstated NFLX with an Equal-Weight rating and a $105.00 price target, aligning with a broader Wall Street consensus and a median target of $113.50. [Source]
Options Activity: New March 2026 put/call options became available, with notable volume at $970 (puts) and $1090 (calls), reflecting market interest in long-term volatility. [Source]
General Sentiment: Positive outlook driven by ad revenue growth expectations and speculation on a Warner Bros. acquisition, though no date-specific news this week. [Source]
3. Technical Analysis 📈
Trend: Uptrend confirmed by price above the 10-day EMA and a series of higher lows.
Support Levels:
$94.61 (major) – recent consolidation area
$90.00 (minor) – secondary support
Resistance Levels:
$97.14 (major) – recent highs and volume profile resistance
$100.00 (psychological)
Pattern: Minor consolidation above $94.00; a breakout could trigger a continuation move.
MACD: Positive, supporting the bullish momentum.
Volume: Increased on up-moves, indicating accumulation and institutional interest.
Chart Summary Table
Support | Resistance | Pattern | Momentum |
|---|---|---|---|
$94.61 / $90.00 | $97.14 / $100.00 | Consolidation | Bullish |
4. Fundamental & News Impact 🔎
While no major earnings or macroeconomic events occurred this week, the analyst community remains constructive. The consensus price target sits at $113.50, with a wide range ($80–$151.40), and sentiment is buoyed by expectations of ad revenue growth and potential strategic moves (e.g., Warner Bros. acquisition rumors). Options activity signals that institutional investors are positioning for volatility, but no clear directional bias emerged from news flow alone.
5. Actionable Scenarios for the Upcoming Week 🚦
Scenario | Trigger/Signal | Entry | Stop Loss | Target | Probability |
|---|---|---|---|---|---|
Bullish | Break above $95.50 | $95.50 | $93.00 | $100.00 | High |
Neutral | Consolidation between $94.00–$97.14 | Wait for clear direction | n/a | n/a | Moderate |
Bearish | Break below $90.00 | n/a | n/a | n/a | Low |
Aggressive traders: Consider buying above $95.50 with a stop at $93.00, targeting $100.00.
Conservative traders: Wait for a pullback to $94.61–$95.00, enter long with a stop at $92.50, targeting $97.14.
Invalidation: A break below $90.00 would shift the bias to neutral/bearish.
Risk management: Risk no more than 1% of capital per trade; use ATR to set stops in line with volatility.
6. Weekly Outlook & Summary 🗓️
Netflix enters Week 12, March 2026, with a bullish technical structure and supportive analyst sentiment. The absence of major news or earnings means technicals are likely to drive price action. Watch for a breakout above $95.50 for bullish continuation, while a drop below $90.00 would warrant caution. Volume and momentum indicators remain positive, but prudent risk management is essential as always.
Disclaimer: This analysis is for informational purposes only and does not constitute investment advice. Please conduct your own research or consult a financial advisor before making trading decisions.

Julian Vance
Julian Vance is a quantitative strategist focused on algorithmic trading in crypto and futures. His work is dedicated to exploring how traders can leverage technology and data to gain a competitive edge.
Join our newsletter list
Sign up to get the most recent blog articles in your email every week.


More Articles


