Bitcoin (BTC/USD) Weekly Analysis & Outlook – Week 8, February 2026
Ideas
3 Min Read
Comprehensive weekly analysis of Bitcoin (BTC/USD) for Week 8, February 2026: price chart, news, technical levels, macro impact, and actionable trading scenarios. Stay informed on BTC trends and forecasts.
Bitcoin (BTC/USD) – Weekly Analysis for Week 8, February 2026
Welcome to our in-depth weekly analysis of Bitcoin (BTC/USD) for Week 8, February 2026. In this comprehensive review, we’ll cover the latest price action, key news events, technical analysis, fundamental drivers, and actionable scenarios for traders and investors. This analysis is based on the latest chart data, news headlines, and market sentiment as of February 23, 2026.
📈 Price Chart Overview
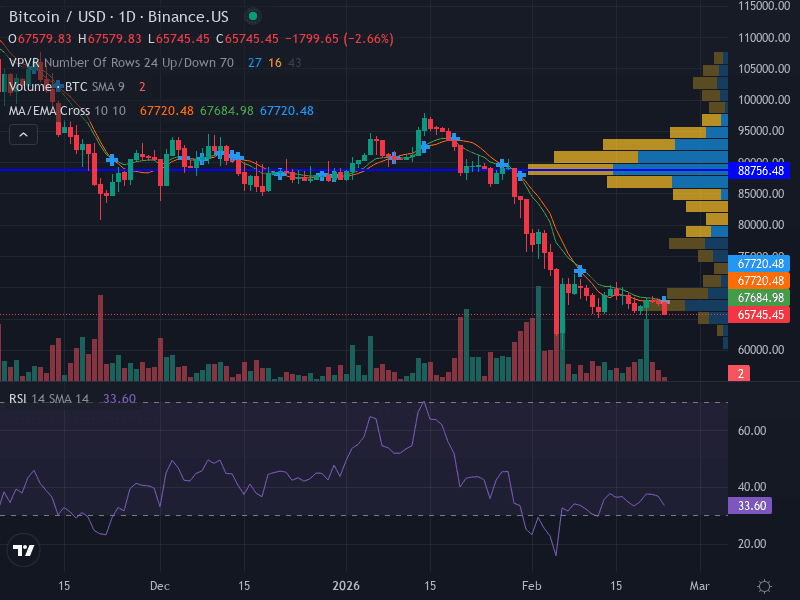
The chart for BTC/USD this week highlights a volatile trading range between $65,000 and $72,000. After a brief surge above $69,000 on February 17, Bitcoin experienced sideways movement, followed by a correction and a drop below $67,000. As of this writing, BTC is stabilizing near $66,800–$68,000, with high trading volumes and notable activity from institutional players.
📰 Latest News & Headlines Impacting BTC
Binance’s $1B Bitcoin Purchase: Binance shifted its $1B SAFU fund into Bitcoin, signaling strong institutional accumulation during a volatile week. (source)
US Inflation Data: January CPI came in lower than expected, briefly boosting BTC to $67,600, though the price later softened as macro uncertainty persisted. (source)
US Supreme Court Tariff Rulings: Recent legal decisions limited presidential tariff powers, introducing a 150-day countdown for new tariffs. BTC held steady near $68,000 amid investor caution. (source)
🔎 Technical Analysis
Indicator | Current Reading | Interpretation |
|---|---|---|
Support Levels | $65,000 / $66,000 | Key zones where buyers have stepped in during pullbacks |
Resistance Levels | $68,000 / $70,000 / $72,000 | Areas where selling pressure has capped rallies |
MACD | Bearish crossover, flattening | Momentum slowing, risk of further downside if not reversed |
Volume | High, with spikes on volatility | Institutional activity and retail reactions to news events |
Pattern | Sideways/Range-bound | Market indecision, awaiting breakout |
Support: The $65,000–$66,000 zone is critical. A sustained break below could trigger further declines toward $62,000.
Resistance: The $68,000–$70,000 area remains a ceiling. Bulls need a close above $70,000 for renewed momentum.
MACD: The MACD shows a recent bearish crossover, indicating waning bullish momentum. Watch for a reversal or further downside confirmation.
Volume: Spikes in volume have accompanied both rallies and sell-offs, suggesting active participation by large players and heightened sensitivity to macro news.
Pattern: The current range-bound structure reflects uncertainty, with traders waiting for a decisive move.
📊 Fundamental & News Impact
Institutional Flows: Binance’s $1B BTC purchase underscores growing institutional involvement, which can provide a floor to prices but also introduce volatility as positions are adjusted.
Macro Environment: Lower-than-expected US inflation is supportive for risk assets like BTC, but ongoing legal and regulatory developments (e.g., Supreme Court tariff rulings) add uncertainty.
Market Sentiment: BTC continues to outperform altcoins (Altcoin Season Index at 29), indicating a risk-off environment where investors prefer Bitcoin’s relative safety.
Forecasts: Analysts like Timothy Peterson and Bernstein remain bullish long-term, with targets of $122,000–$150,000 by year-end, though near-term risks remain elevated.
🧭 Possible Scenarios for the Upcoming Week
Scenario | Trigger | Key Levels | Probability | Actionable Idea |
|---|---|---|---|---|
Bullish 🚀 | Break above $68,000–$70,000 with strong volume | $70,000, $72,000, $75,000 | Moderate | Consider long positions above $70,000 with tight stops |
Bearish 🐻 | Break below $66,000, macro risk-off events | $65,000, $62,000 | Moderate | Short or hedge below $66,000, target $62,000 |
Neutral ⚖️ | Range-bound between $66,000–$70,000 | $66,000–$70,000 | High | Range trade, fade extremes, wait for breakout |
Bullish Case: A sustained move above $70,000 could trigger a run to $72,000 or higher, especially if macro data remains supportive and institutional flows persist.
Bearish Case: A break below $66,000 would expose BTC to further downside, with $65,000 and $62,000 as next supports. Watch for negative macro headlines or regulatory shocks.
Neutral Case: Most likely scenario is continued range-bound trading as the market digests recent news and awaits new catalysts.
🔔 Key Takeaways & Trading Tips
Monitor macro headlines, especially around US inflation and global tariffs.
Watch volume and price action near key levels ($66,000 and $70,000) for signs of breakout or breakdown.
Consider risk management strategies, including stop-losses and position sizing, given heightened volatility.
Stay alert to institutional activity, as large flows can quickly shift market direction.
📅 Calendar & Upcoming Events
US economic data releases (CPI, PPI, employment)
Potential regulatory updates or legal rulings
Major exchange or ETF announcements
Conclusion
Bitcoin enters Week 8, February 2026, at a crossroads, with technicals signaling indecision and fundamentals offering both support and risk. The coming week will likely see continued volatility as traders react to macro headlines and institutional flows. Stay nimble, manage risk, and be prepared for multiple scenarios as the market seeks direction.
Disclaimer: This analysis is for informational purposes only and does not constitute financial advice. Please conduct your own research and consult a professional before making investment decisions.

Julian Vance
Julian Vance is a quantitative strategist focused on algorithmic trading in crypto and futures. His work is dedicated to exploring how traders can leverage technology and data to gain a competitive edge.
Join our newsletter list
Sign up to get the most recent blog articles in your email every week.


More Articles


