Ethereum (ETHUSD) Weekly Analysis & Outlook – Week 3, January 2026
Ideas
3 Min Read
In-depth weekly analysis of Ethereum (ETHUSD) for Week 3, January 2026: chart, technicals, news, catalysts, and actionable trading scenarios. Stay ahead with support/resistance, MACD, volume, and ETF/regulatory updates.
Welcome to the Ethereum (ETHUSD) weekly analysis for Week 3, January 2026! This comprehensive outlook covers the latest price action, technical chart insights, fundamental news, and actionable scenarios for traders and investors. 🚀
Summary of This Week’s Ethereum Outlook
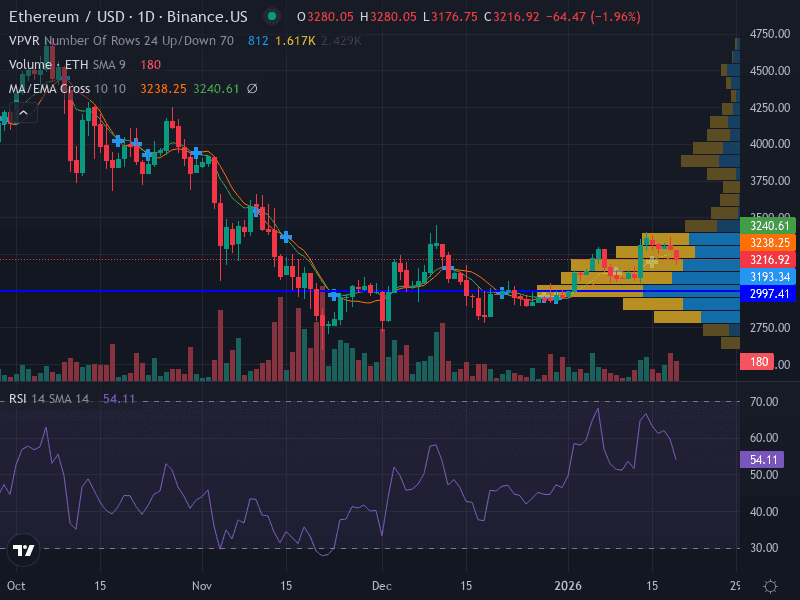
Ethereum is currently consolidating in a neutral range, with price action hovering between $3,193 and $3,240. The market is at a crossroads, with no clear breakout direction yet. ETF inflows, surging network activity, and regulatory developments are providing a supportive backdrop, but technicals remain mixed. Let’s dive into the details.
Ethereum Price Chart Overview
Trend: Sideways, price near 10-day EMA
Support: $3,193 (major), $2,997 (minor)
Resistance: $3,240 (major), $3,280 (minor)
Momentum: RSI at 54.1 (neutral, slight bullish tilt)
Volume: Modest, with slight increases on rallies
Pattern: Range-bound, no distinct breakout yet
Latest News & Catalysts (Jan 12–18, 2026)
Catalyst | Details | Potential Impact | Source |
|---|---|---|---|
ETF Inflows & Institutional Demand | ~$480M net inflows last week; whale accumulation; price stabilizing near 200-day EMA | Bullish support near $3,300, potential for breakout | |
Network Activity Surge | On-chain metrics and network activity rising, higher lows since Nov 2025 | Signals possible upside continuation | |
Regulatory Catalyst | U.S. CLARITY Act under Senate review (Jan 15), may boost DeFi/ETH if passed | Potentially positive for ETH and DeFi sector |
Technical Analysis
Support Levels: $3,193 (major), $2,997 (minor)
Resistance Levels: $3,240 (major), $3,280 (minor)
Pattern: Range-bound between $3,193 and $3,240; no clear breakout
MACD: Not shown on chart, but local momentum remains flat; watch for crossovers
Volume: Slightly increasing on minor rallies, indicating cautious accumulation
RSI: 54.1 (neutral, with a slight bullish tilt)
Ethereum is consolidating, with price action tightly bound between support and resistance. The lack of a clear trend suggests traders should wait for a decisive move before committing to a direction. Volume upticks on rallies hint at underlying demand, but not enough to confirm a breakout yet.
Fundamental & News Impact
ETF Inflows: Major institutional demand, with $480M in net inflows last week, is supporting prices and could trigger a breakout if sustained.
Network Activity: On-chain metrics are surging, and whale accumulation is evident, both bullish signals for medium-term growth.
Regulation: The U.S. CLARITY Act, if passed, could unlock new DeFi growth and further support Ethereum’s price.
Analyst Outlook: StanChart calls 2026 the "year of Ethereum," with a long-term target of $40,000 by 2030, though the short-term forecast is more cautious.
Actionable Scenarios for the Upcoming Week
Scenario | Trigger | Entry | Stop Loss | Target | Probability |
|---|---|---|---|---|---|
Bullish Breakout | Break above $3,280 | $3,285 | $3,200 | $3,400 – $3,505 | Moderate |
Bearish Breakdown | Close below $2,997 | $2,990 | $3,050 | $2,850 – $2,700 | Low |
Neutral/Range | Stays between $3,193 and $3,240 | N/A | N/A | N/A | High |
Bullish scenario: A breakout above $3,280 could see ETH rally toward $3,400–$3,505, especially if ETF inflows persist and network activity continues to rise.
Bearish scenario: A sustained close below $2,997 would likely trigger a move toward $2,850 or lower, especially if macro sentiment sours or regulatory news disappoints.
Neutral scenario: Most probable for the week, with ETH likely to remain range-bound as traders await a catalyst.
Risk Management
Risk only 1% of capital per trade.
Use ATR (14-day) to set stop distances.
Wait for confirmation before entering breakout trades.
Conclusion
Ethereum is at a pivotal juncture this week, consolidating in a tight range as institutional flows, on-chain activity, and regulatory developments shape the outlook. While the long-term picture remains bullish, short-term traders should watch for a breakout or breakdown from the current range before taking action. Stay alert to ETF news, regulatory headlines, and volume/momentum shifts.
Disclaimer: This analysis is for informational purposes only and does not constitute financial advice. Always do your own research and consult a professional before making trading decisions.

Julian Vance
Julian Vance is a quantitative strategist focused on algorithmic trading in crypto and futures. His work is dedicated to exploring how traders can leverage technology and data to gain a competitive edge.
Join our newsletter list
Sign up to get the most recent blog articles in your email every week.


More Articles


