Cardano (ADAUSD) Weekly Analysis – Week 3, January 2026
Ideas
3 Min Read
In-depth Cardano (ADAUSD) analysis for Week 3, January 2026: chart review, technical levels, news impact, and actionable trading scenarios. Stay ahead with support/resistance, MACD, volume, and fundamental insights.
Welcome to the Cardano (ADAUSD) weekly analysis for Week 3, January 2026! In this comprehensive review, we’ll break down the latest price action, technical structure, and fundamental context to help traders and investors navigate the current landscape. All data and analysis are current as of January 19, 2026.
📊 Chart Overview & Executive Summary
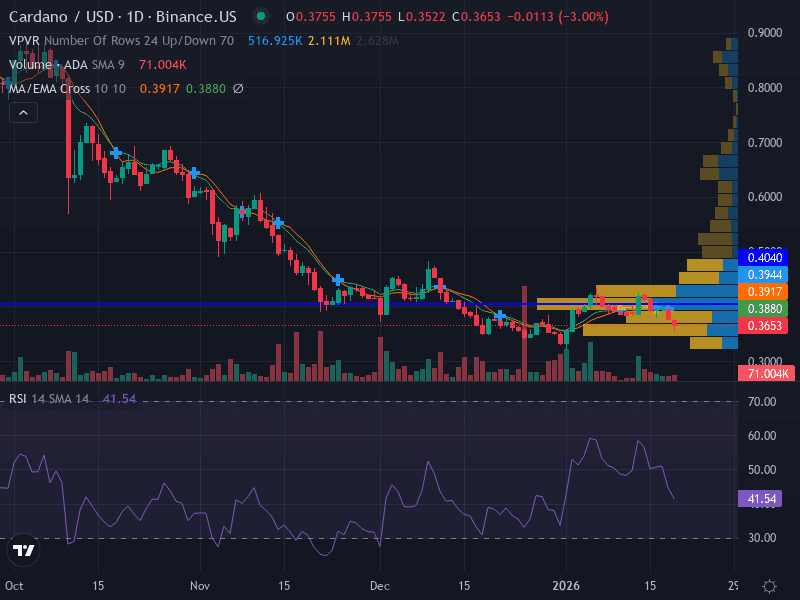
Trend: Bearish – Price is below the 9-day EMA, forming lower highs and lower lows.
Momentum: RSI at 41.54 (bearish), MACD confirms declining momentum.
Pattern: Descending channel with recent rejection at the 9-day EMA.
Volume: Moderate, with increased activity on downswings, indicating steady selling pressure.
Key Levels: Support at $0.365 (major), $0.350 (minor); Resistance at $0.388 (major), $0.404 (minor).
📰 Latest News & Short-Term Catalysts
Date | Headline / Event | Source |
|---|---|---|
2026-01-13 | ADA broke local support at $0.3853, signaling further downside risk if daily close remains below this level. | |
2026-01-18 | Changelly forecasts ADA trading in a narrow range ($0.392–$0.428) for January 2026, with risk of dips to $0.381. | |
2026-01-15 | Technical analysis points to a possible breakout toward $0.45, but only if volume and momentum improve; otherwise, risk of further decline. |
Summary: No major fundamental news or upgrades in the past week. The focus remains on technical levels and price action, with analysts watching for a decisive move at key supports.
📈 Technical Analysis
Support Levels:
$0.365 – Major support, recent local low. A break below could accelerate selling.
$0.350 – Minor support, potential next target if $0.365 fails.
Resistance Levels:
$0.388 – Major resistance, recent high and 9-day EMA zone.
$0.404 – Minor resistance, upper channel boundary.
Pattern: Descending channel, with price repeatedly rejected at the 9-day EMA. This structure suggests persistent bearish pressure.
MACD: Bearish, with the MACD line below the signal line and histogram negative. No bullish crossover signal yet.
Volume: Moderate, but spikes on down days confirm active selling. No capitulation volume yet, so trend may persist.
RSI: At 41.54, indicating weak momentum and room for further downside before oversold conditions.
Technical Table
Indicator | Value | Interpretation |
|---|---|---|
9-day EMA | ~$0.388 | Price below EMA, bearish bias |
RSI | 41.54 | Weak momentum, not oversold |
MACD | Bearish | No bullish reversal yet |
Volume | Moderate | Spikes on down days, selling pressure |
Pattern | Descending channel | Lower highs/lows, trend continuation |
🔍 Fundamental & News Impact
No major upgrades or ecosystem news in the past week. The upcoming Midnight blockchain launch in 2026 remains a longer-term catalyst, but has not yet impacted price action.
On-chain metrics (MVRV, active addresses) show consolidation, but no clear bullish divergence.
Market sentiment is cautious, with traders watching for a break of $0.365 support or a reversal above $0.388 resistance.
📅 Scenarios for the Upcoming Week
Scenario | Trigger | Price Levels | Probability | Actionable Idea |
|---|---|---|---|---|
Bullish 🟢 | Break and close above $0.388 (9-day EMA) | Target $0.404, then $0.428 | Low to Moderate | Wait for confirmed breakout above $0.388 before considering long positions. |
Bearish 🔴 | Break and close below $0.365 | Target $0.350, then $0.340 | Moderate to High | Short on breakdown below $0.365, stop-loss at $0.370, target $0.350. |
Neutral 🟡 | Range-bound between $0.365 and $0.388 | Chop zone: $0.365–$0.388 | Moderate | Wait for clear direction; avoid overtrading in the chop. |
🚦 Risk Management & Trade Ideas
Aggressive: Short at $0.375 (confirmation of resistance at EMA), stop-loss $0.388, target $0.365.
Conservative: Wait for a break below $0.365, enter short $0.360–$0.355, stop-loss $0.370, target $0.350.
Invalidation: A break and close above $0.388 would shift bias to neutral/bullish.
Risk: Limit risk to 0.5–1% of capital per trade; consider ATR-based stops for volatility.
📝 Conclusion
Cardano (ADAUSD) enters Week 3 of January 2026 with a clear bearish bias, as technicals dominate the landscape and no major news shifts sentiment. Traders should focus on the $0.365 support and $0.388 resistance for directional clues, and manage risk carefully as volatility may increase if these levels break. Stay alert for any surprise ecosystem developments or macro shifts that could alter the outlook.
Disclaimer: This analysis is for informational purposes only and does not constitute financial advice. Please conduct your own research and consult a professional before making trading decisions.

Julian Vance
Julian Vance is a quantitative strategist focused on algorithmic trading in crypto and futures. His work is dedicated to exploring how traders can leverage technology and data to gain a competitive edge.
Join our newsletter list
Sign up to get the most recent blog articles in your email every week.


More Articles


