Bitcoin (BTC/USD) Weekly Analysis & Outlook – Week 3 May 2026
Ideas
3 Min Read
In-depth weekly analysis for BTC/USD (Bitcoin) for Week 3 of May 2026: chart, technicals, news, support/resistance, and actionable scenarios. Stay updated on BTC trends and catalysts.
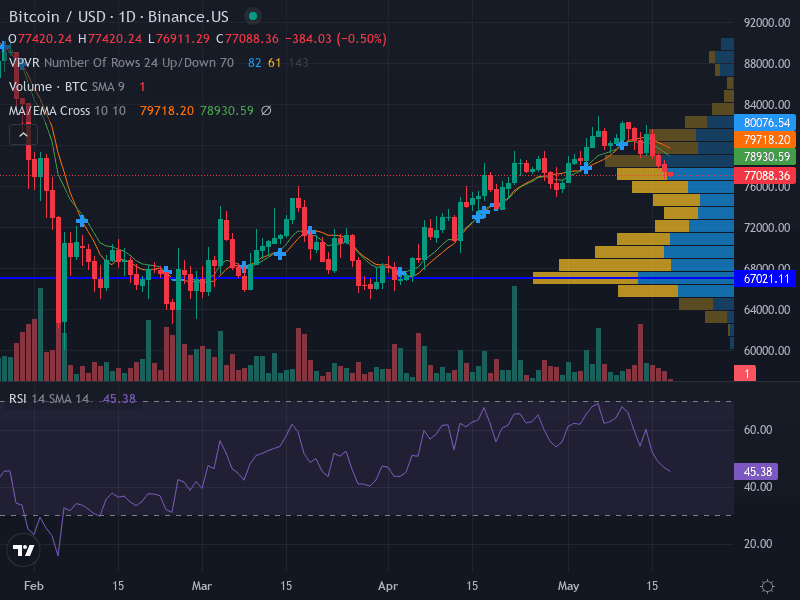
Welcome to our in-depth Bitcoin (BTC/USD) analysis for Week 3 of May 2026! This comprehensive blog covers the latest technical and fundamental developments, key support and resistance levels, and actionable trading scenarios for the week ahead. Whether you are a trader or investor, this analysis provides a clear, data-driven view of the current BTC landscape. ₿
📈 Chart Overview & Technical Structure
Trend: Sideways/Neutral – BTC is oscillating around its 10-day moving average, showing no clear directional bias.
Momentum: RSI at 45.38 – Weak momentum, slightly below neutral, not oversold.
Pattern: Range-bound between $73,000 (major support) and $80,076 (major resistance).
Volume: Decreasing on recent moves, indicating lack of conviction among buyers and sellers.
Key Level | Type | Significance |
|---|---|---|
$73,000 | Support | Major – Previous consolidation area |
$67,000 | Support | Minor – Lower range boundary |
$79,718 | Resistance | Minor – Recent swing high |
$80,076 | Resistance | Major – Previous highs, range top |
📰 News & Fundamental Context (May 11–18, 2026)
BTC Price Action: Bitcoin traded between $78,000 and $81,200, with a quick recovery from a $75,500 dip caused by Middle East geopolitical tensions. (Fortune)
Regulatory Progress: The U.S. Senate CLARITY Act advanced, reducing crypto regulatory uncertainty and potentially encouraging institutional buying. (Binance)
Macro Environment: Strong S&P 500 performance supported risk appetite, while high oil prices and Middle East tensions remained overhangs. (Crypto.news)
🔎 Technical Analysis
Support: $73,000 (major), $67,000 (minor)
Resistance: $79,718 (minor), $80,076 (major)
Pattern: BTC is consolidating in a horizontal range, with price action choppy and lacking clear trend direction.
MACD: Mixed signals, with no strong bullish or bearish momentum.
Volume: Declining, suggesting traders are waiting for a breakout or breakdown before committing capital.
Indicator | Current Reading | Interpretation |
|---|---|---|
RSI | 45.38 | Weak, slightly bearish |
MACD | Flat/Neutral | No clear momentum |
Volume | Decreasing | Low conviction |
💡 Fundamental & News Impact
Regulatory: Progress on the CLARITY Act and SEC–CFTC coordination is a positive for institutional sentiment, but uncertainty remains over DeFi liability provisions.
Macro: Strong equities and risk appetite are supportive, but oil price spikes and geopolitical risks could trigger volatility.
Crypto-Specific: Spot Bitcoin ETF flows and institutional demand are ticking up, especially on dips near $75,500–$78,000.
Election Cycle: Historical post-midterm election gains (average +54%) are a bullish narrative, but not an immediate catalyst.
📊 Scenario Outlook for Week 3 May 2026
Scenario | Trigger | Actionable Levels | Probability |
|---|---|---|---|
Bullish 📈 | Break and close above $80,076 | Buy above $80,076, SL $77,000, Target $85,000 | Moderate (if regulatory news is positive) |
Bearish 📉 | Break and close below $73,000 | Sell below $73,000, SL $75,000, Target $67,000 | Low–Moderate (if macro/geopolitical risks escalate) |
Neutral/Range 🔄 | Price remains between $73,000 and $80,076 | Range trade: Sell near $79,718–$80,076, Buy near $73,000 | High (current structure favors range-bound action) |
Risk Management Tips
Risk 0.5–1% of capital per trade.
Consider using ATR(14) for dynamic stop placement.
Be alert for news-driven volatility, especially from regulatory or geopolitical headlines.
🔔 Summary & Takeaways
BTC/USD is consolidating in a well-defined range, with key levels at $73,000 (support) and $80,076 (resistance).
Regulatory progress and macro risk appetite are supportive, but geopolitical risks and low momentum keep the outlook neutral.
Most probable scenario: Range-bound trading, with breakout/breakdown levels to watch for directional trades.
Disclaimer: This analysis is for informational purposes only and does not constitute investment advice. Please conduct your own research and consult a professional before making trading decisions.

Julian Vance
Julian Vance is an independent writer and quantitative strategist. He writes about trading automation and account-management workflows for Copygram.
Join our newsletter list
Sign up to get the most recent blog articles in your email every week.

More Articles